Spotify reporting without spreadsheet work
A data platform that helped Major track playlist performance and report on Spotify campaigns across markets.
- Role
- Project Manager and lead developer
- Team
- Arpita GuptaHimanshu Sharma
- Tools
- WeWeb, Xano, third-party APIs, Figma
Overview
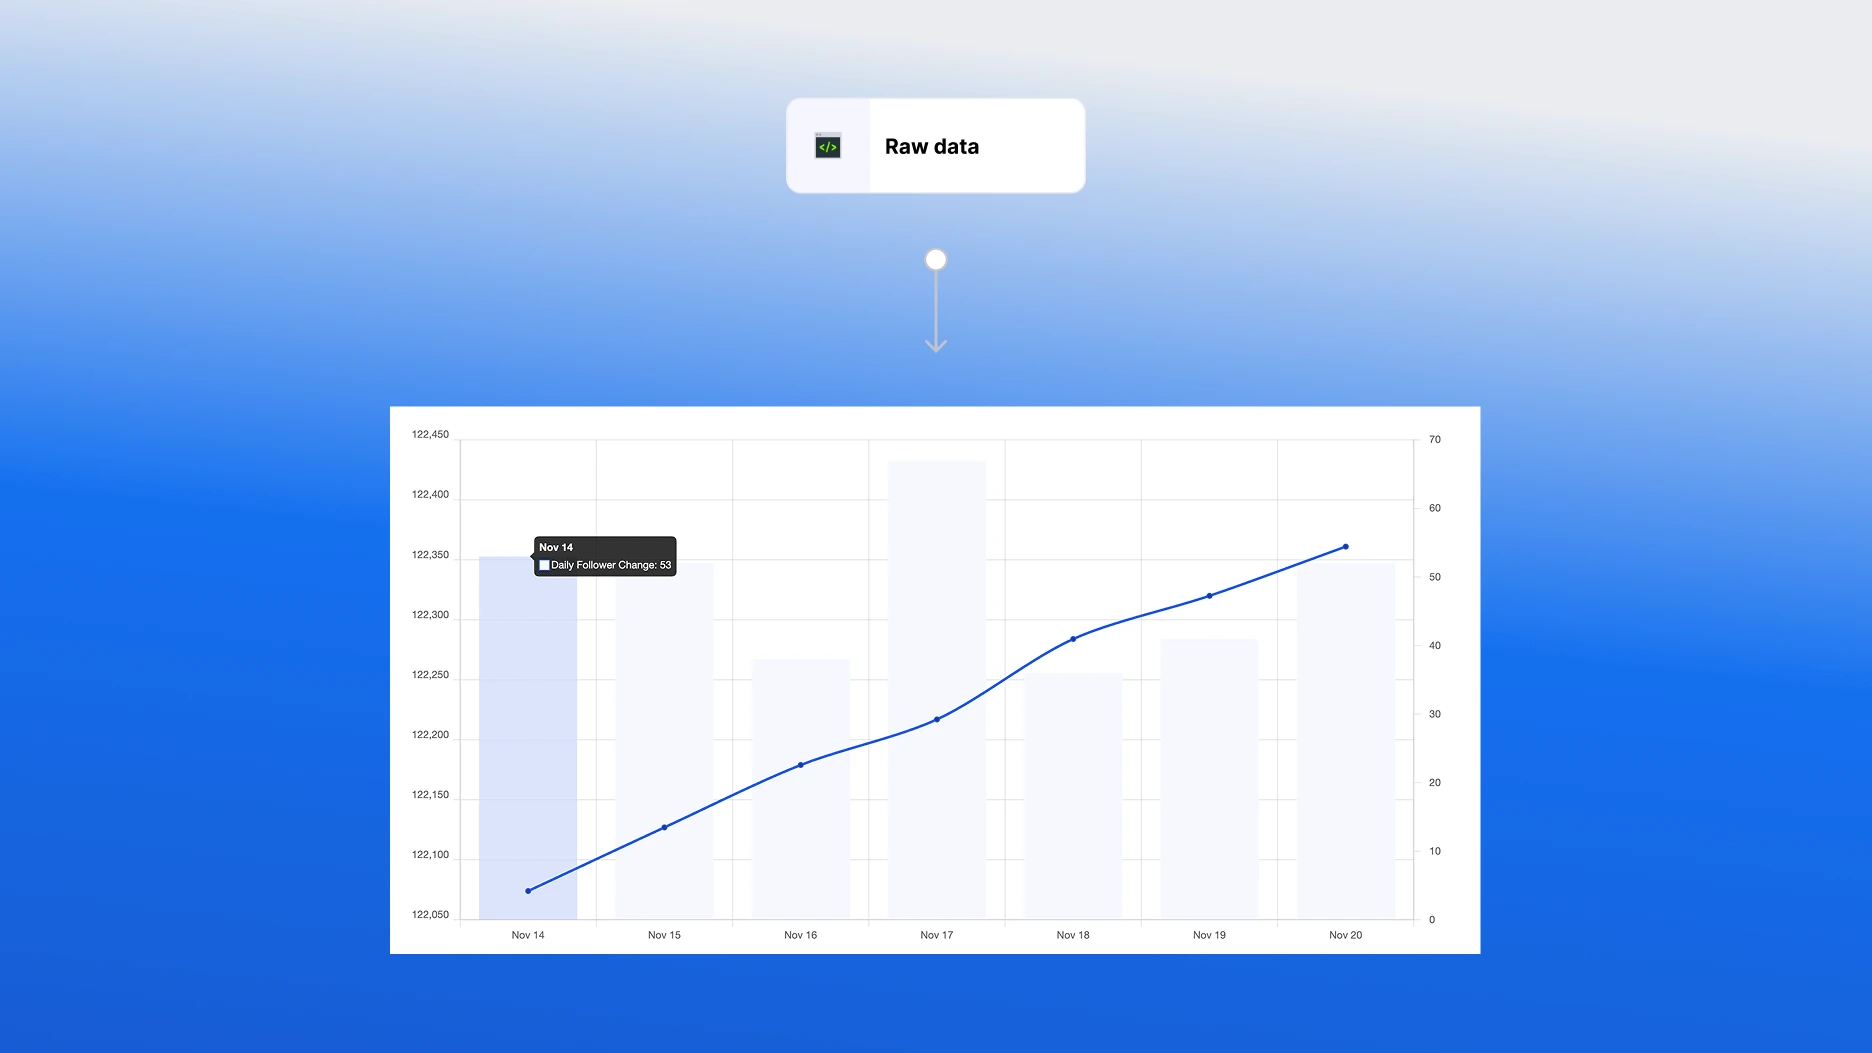
Daily data collection powered client reports
Major is a Dutch consultancy that helps studios and music labels with Spotify performance marketing. The team had to collect playlist rankings, follower counts, and campaign details by hand, then prepare weekly reports for clients.
As Project Manager and lead developer, I mapped the requirements and user journeys with the team. We built a platform that collected daily data and connected it to ad campaigns.
Challenge
Manual reporting limited the service
Each client took about 40 hours per month of manual reporting and analysis. The team moved data through spreadsheets and emailed weekly reports. Taking on another client meant more repetitive work and less time for campaign advice.
The platform needed to collect data reliably across many countries and make campaign changes easier to compare with playlist performance.
Approach
Collect daily data and connect it to campaigns
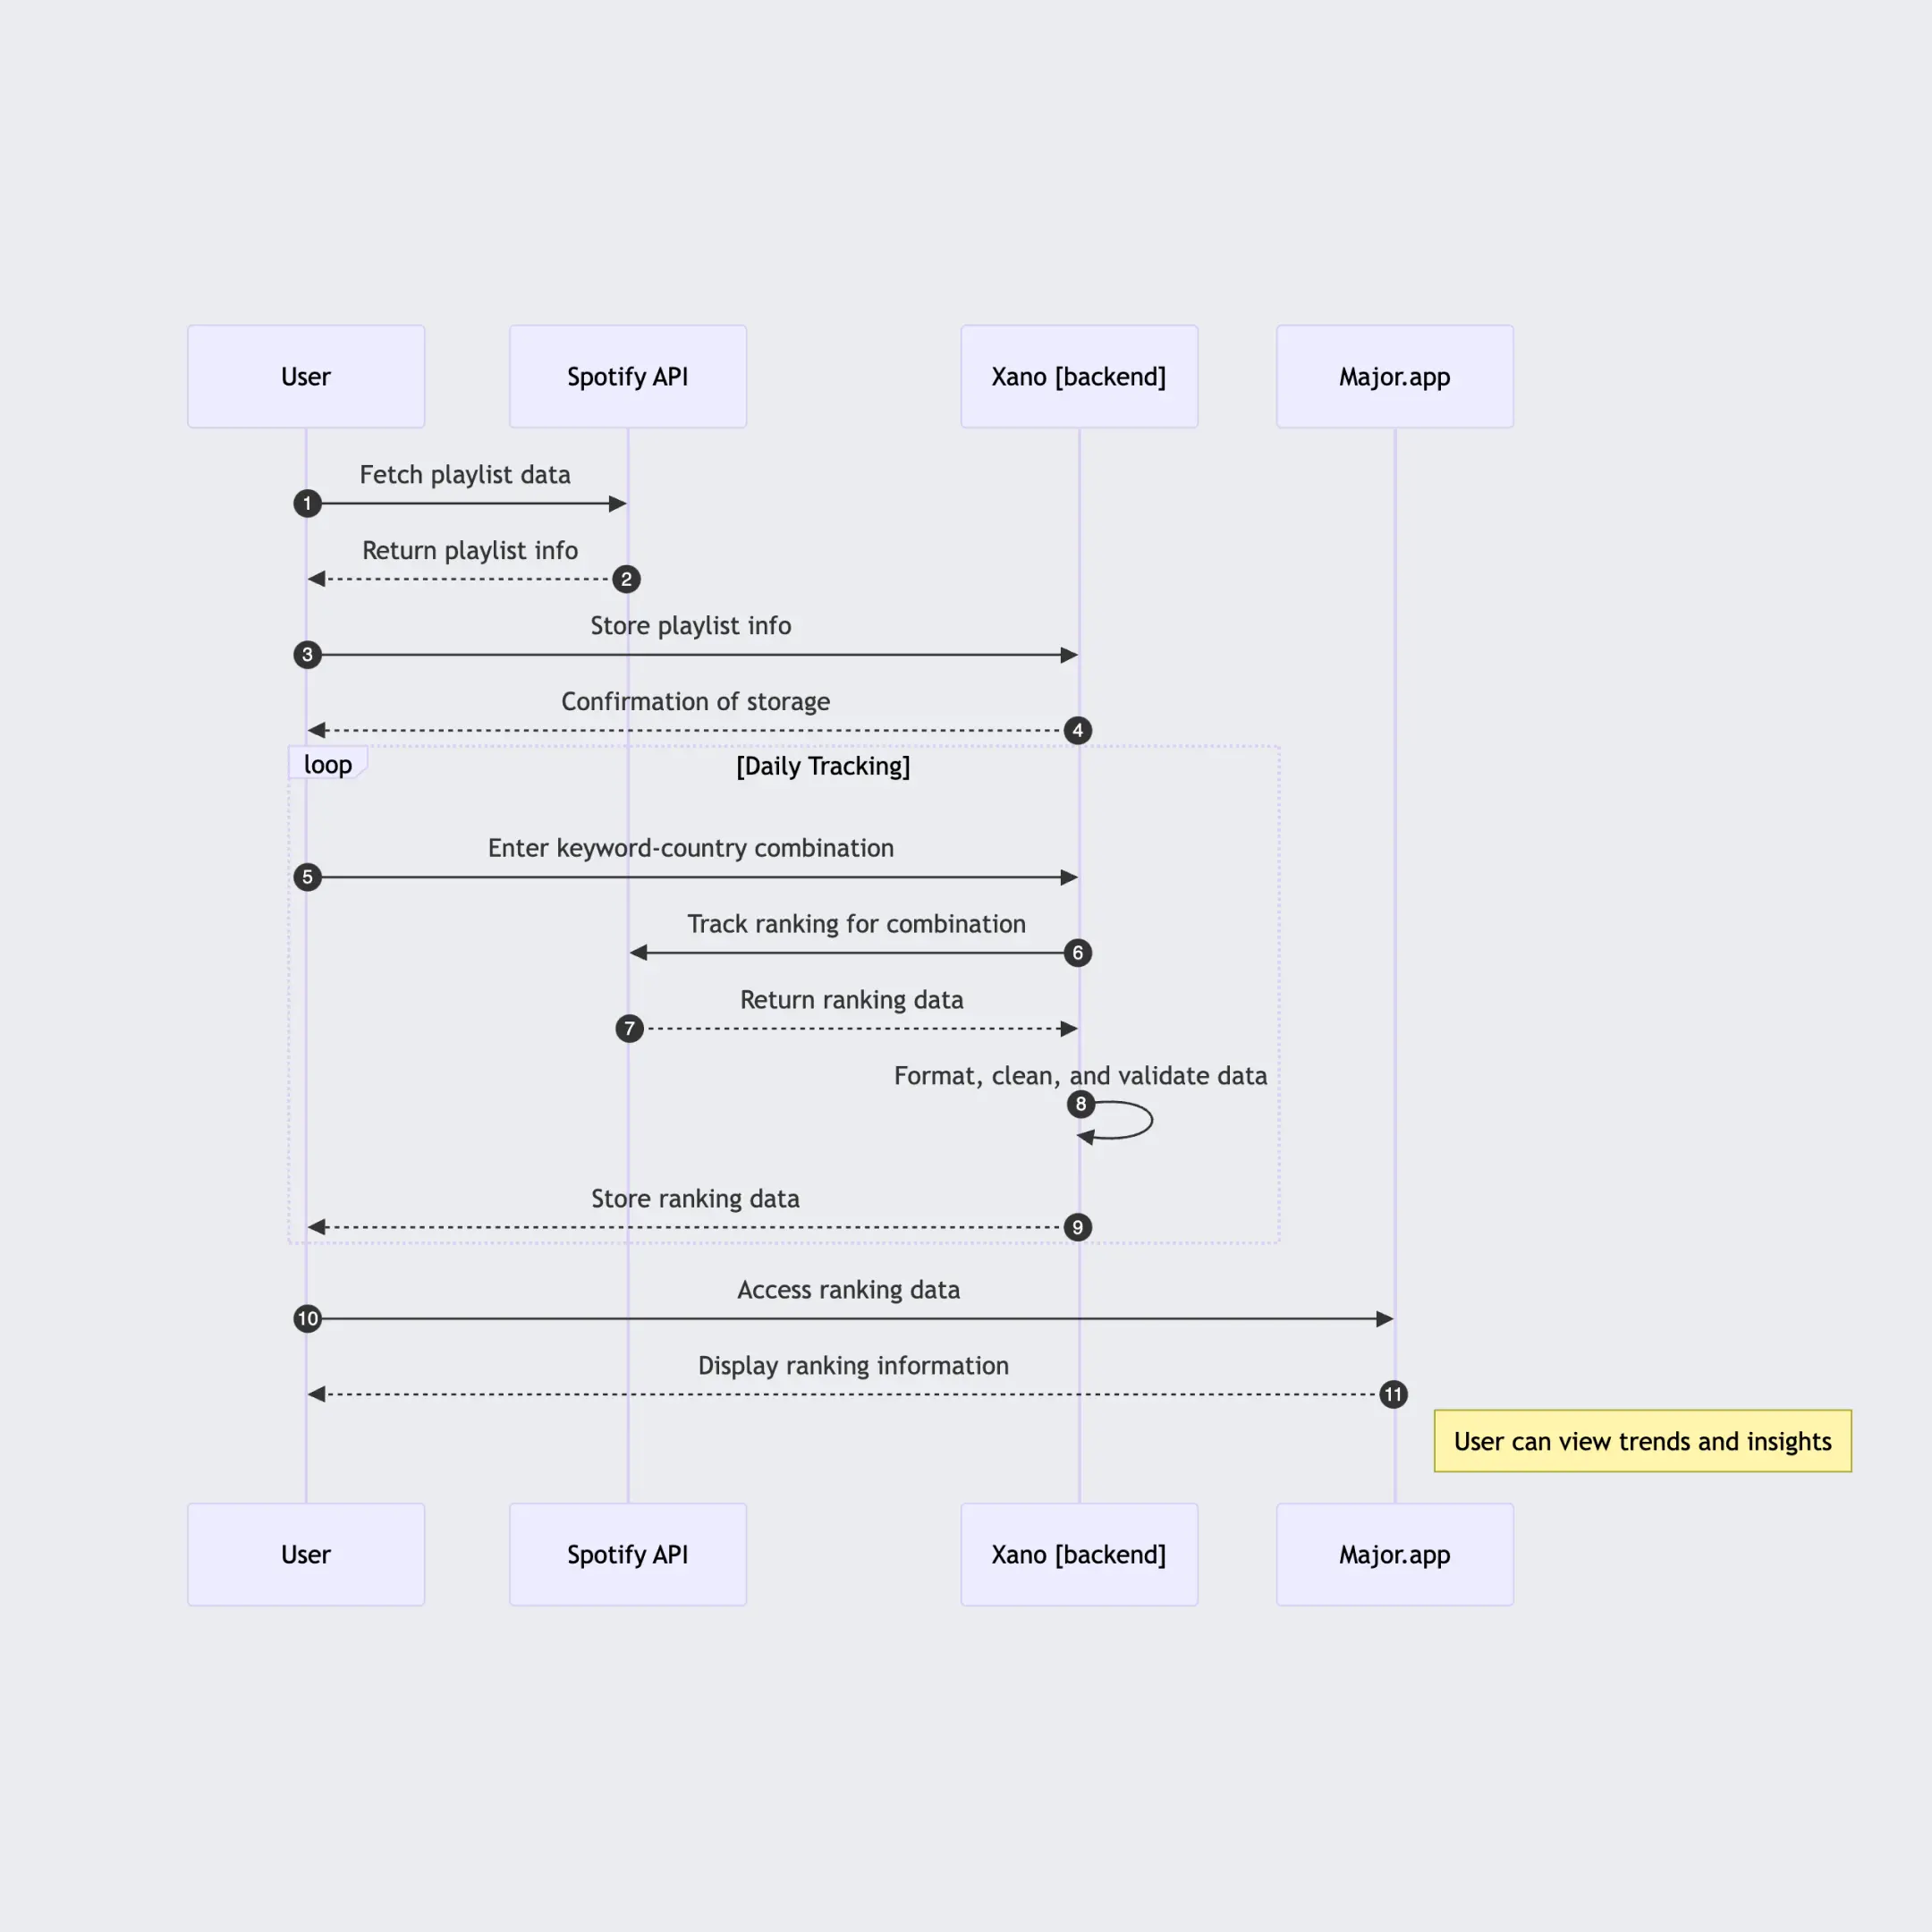
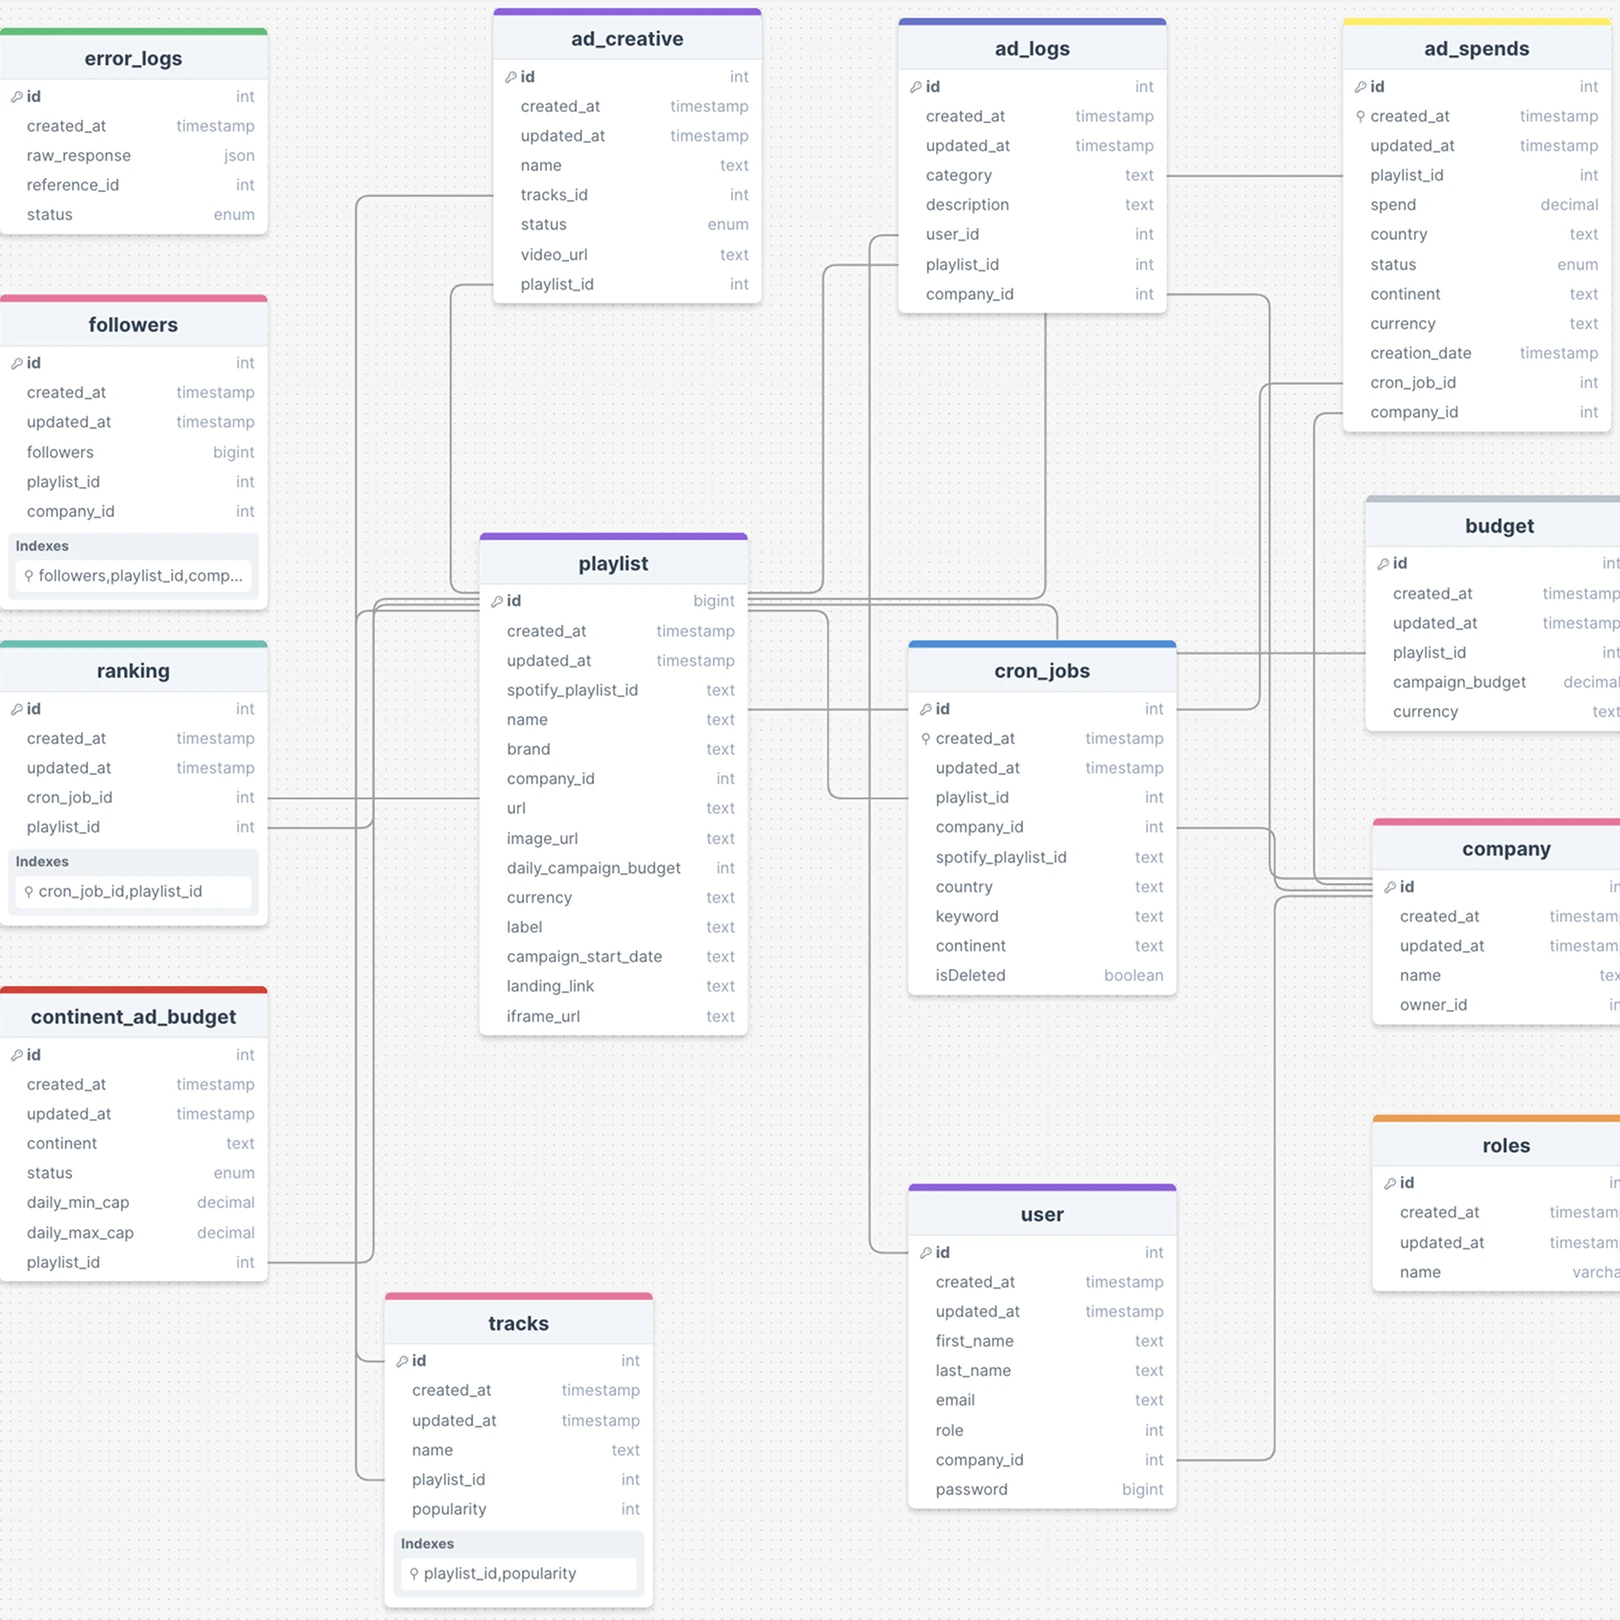
The platform stored its data in PostgreSQL. We used WeWeb for the interface, RapidAPI for unofficial Spotify APIs, and Cloudflare Workers to run the collection jobs.
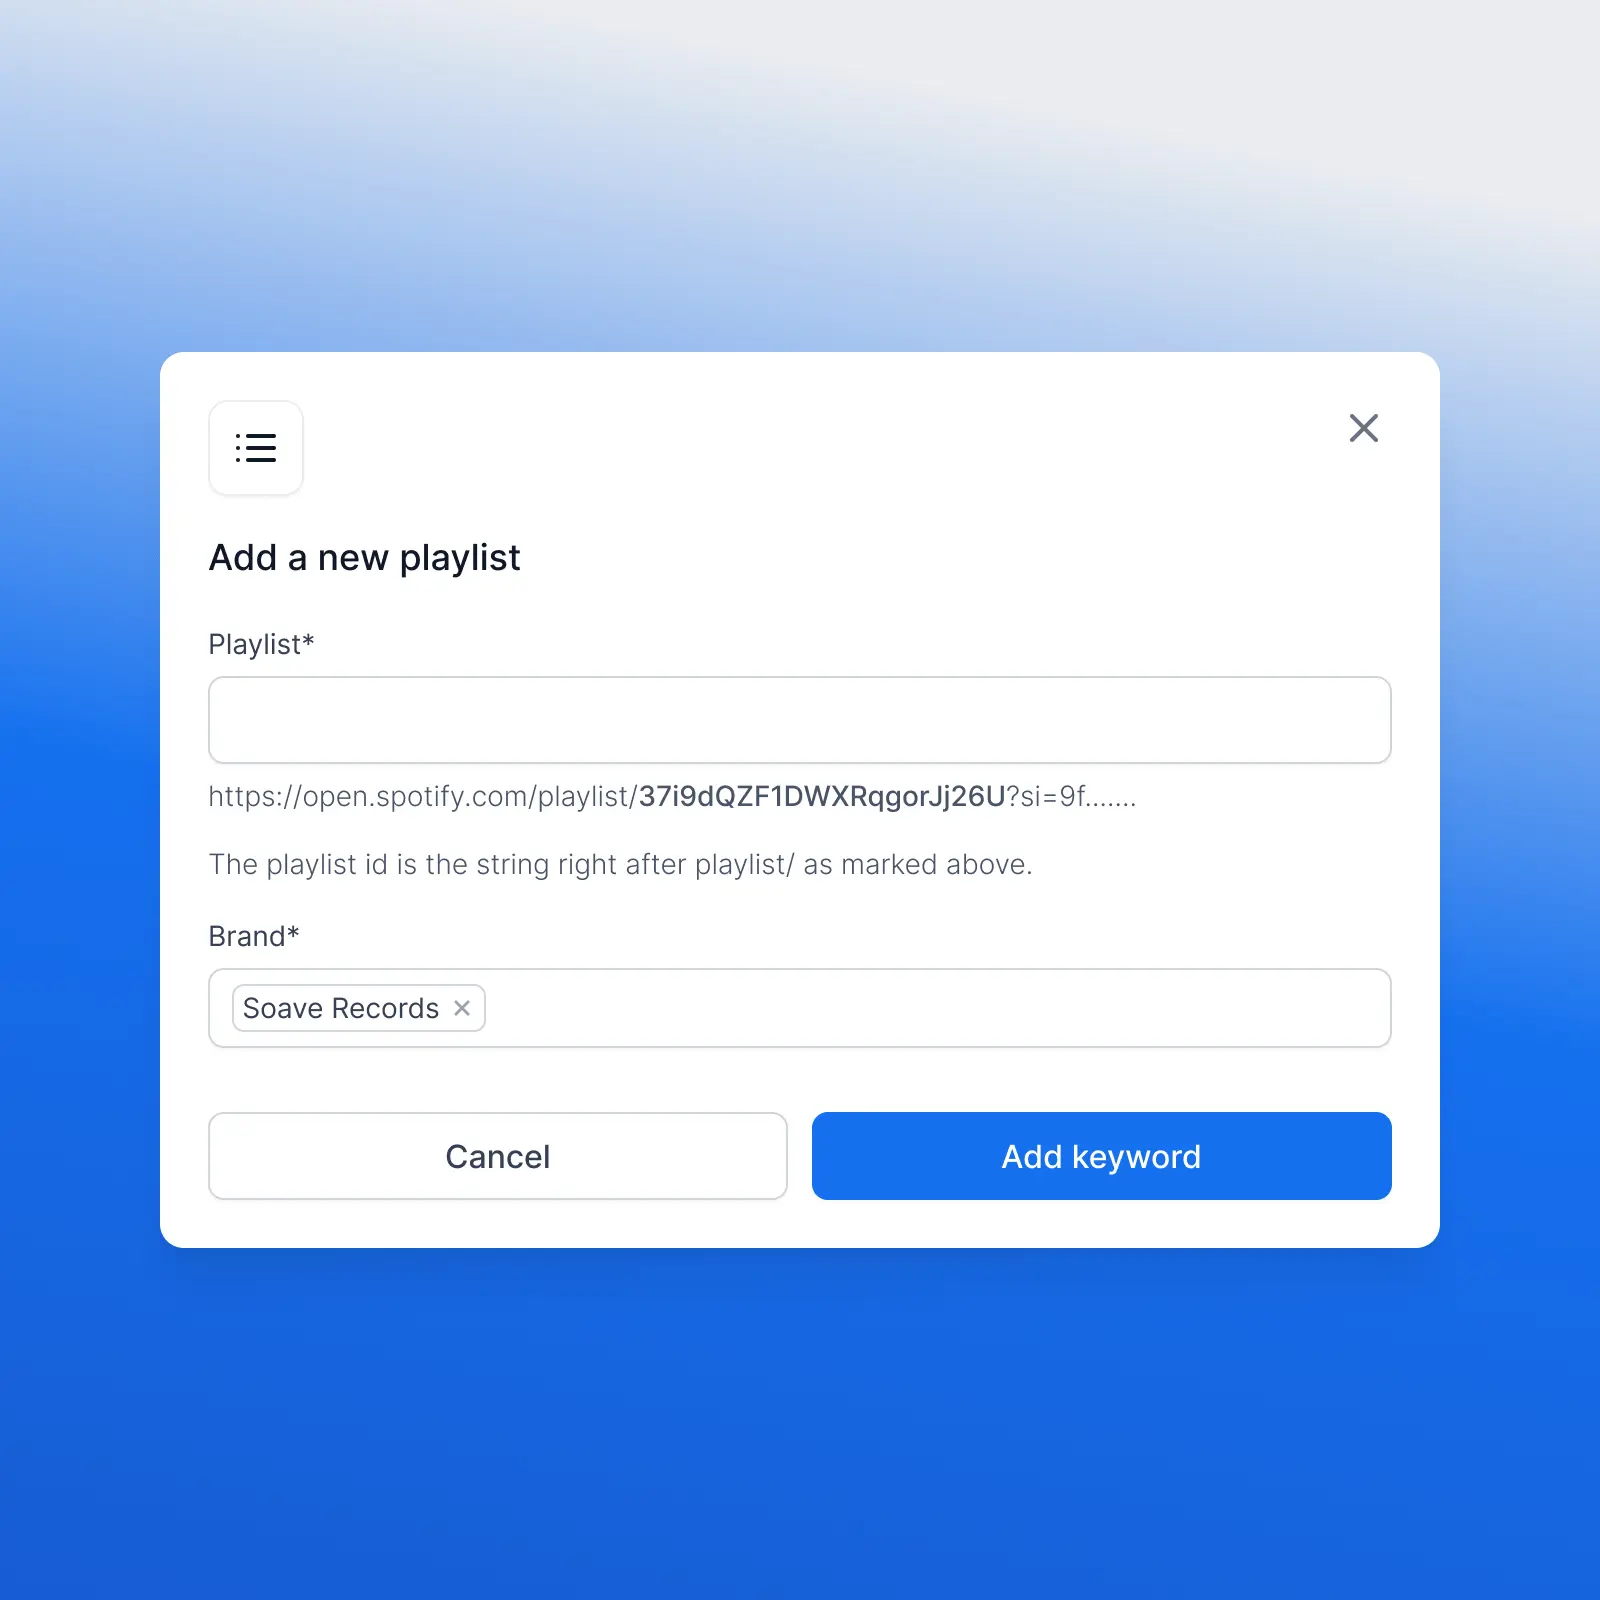
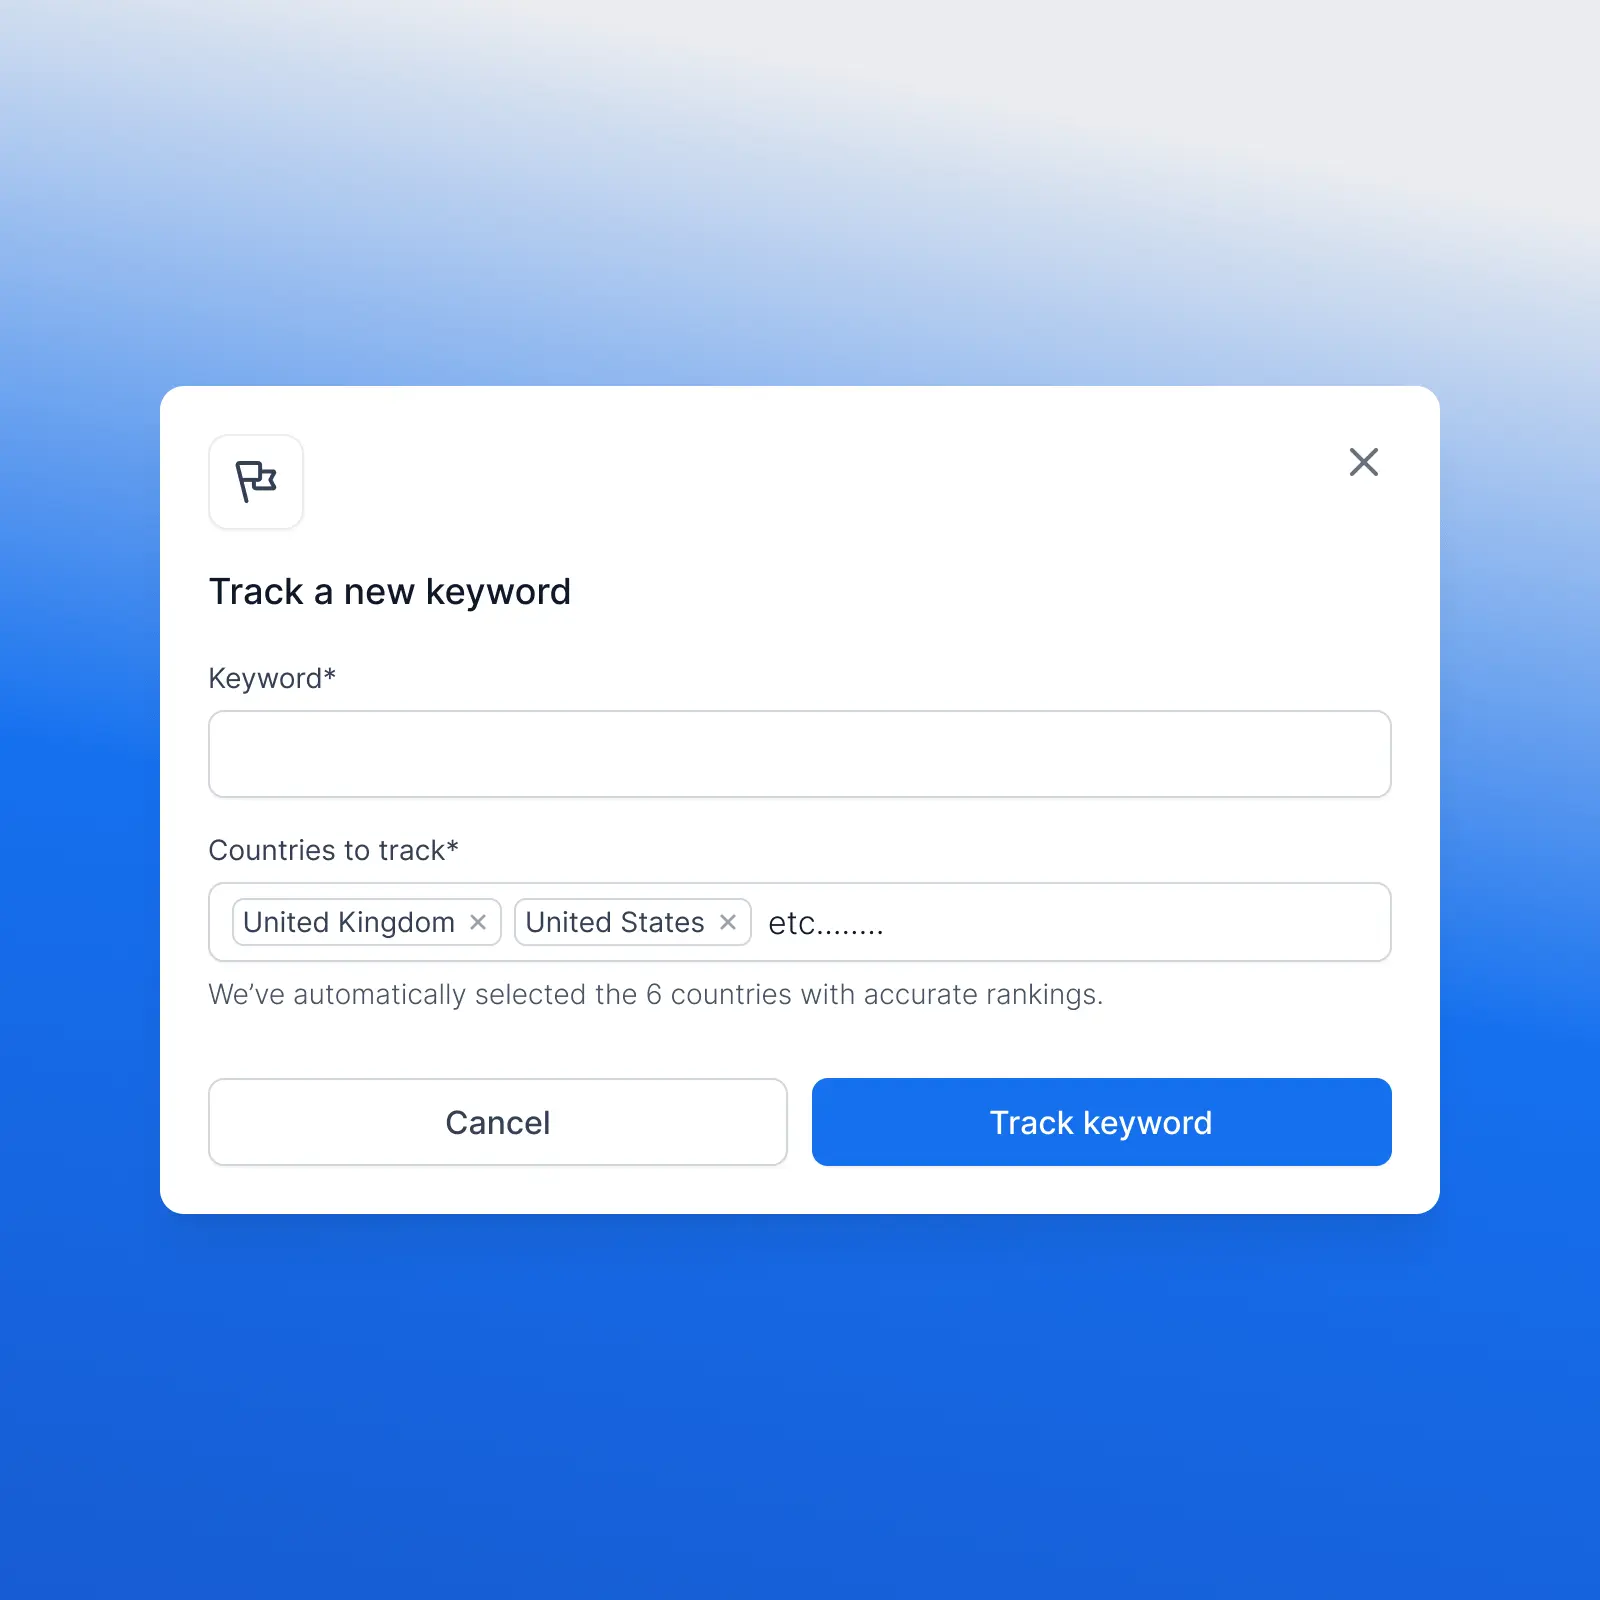
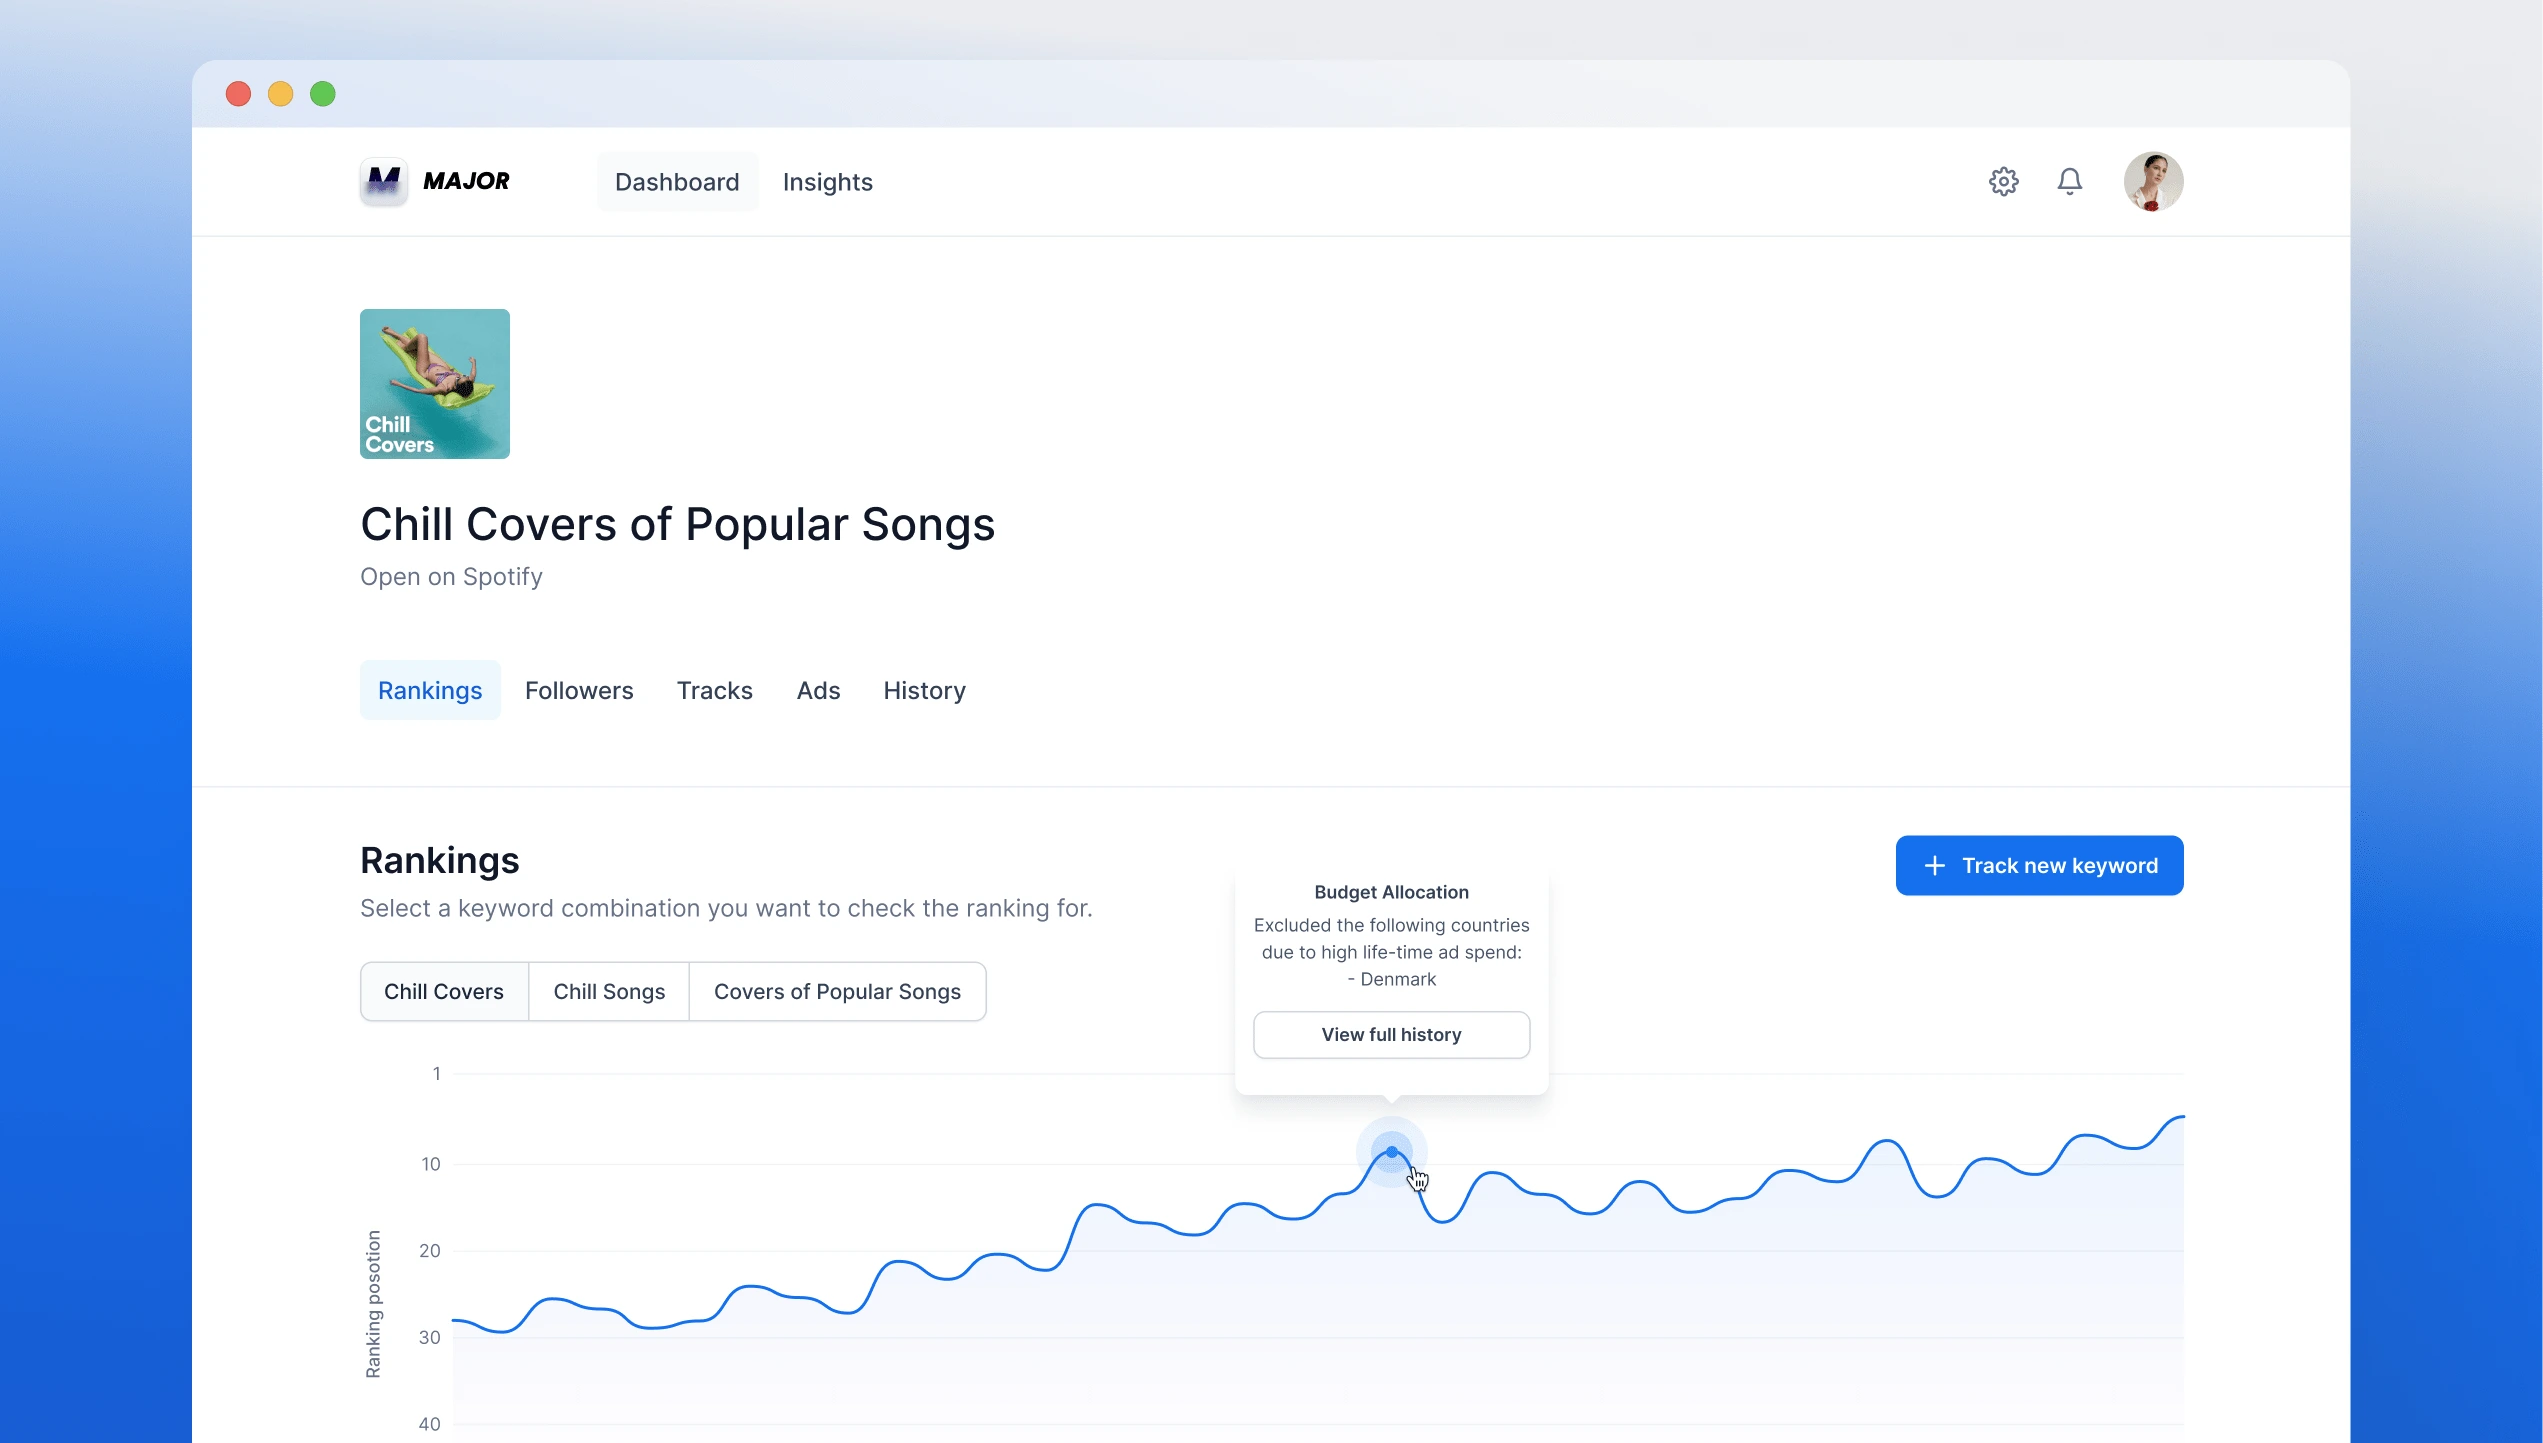
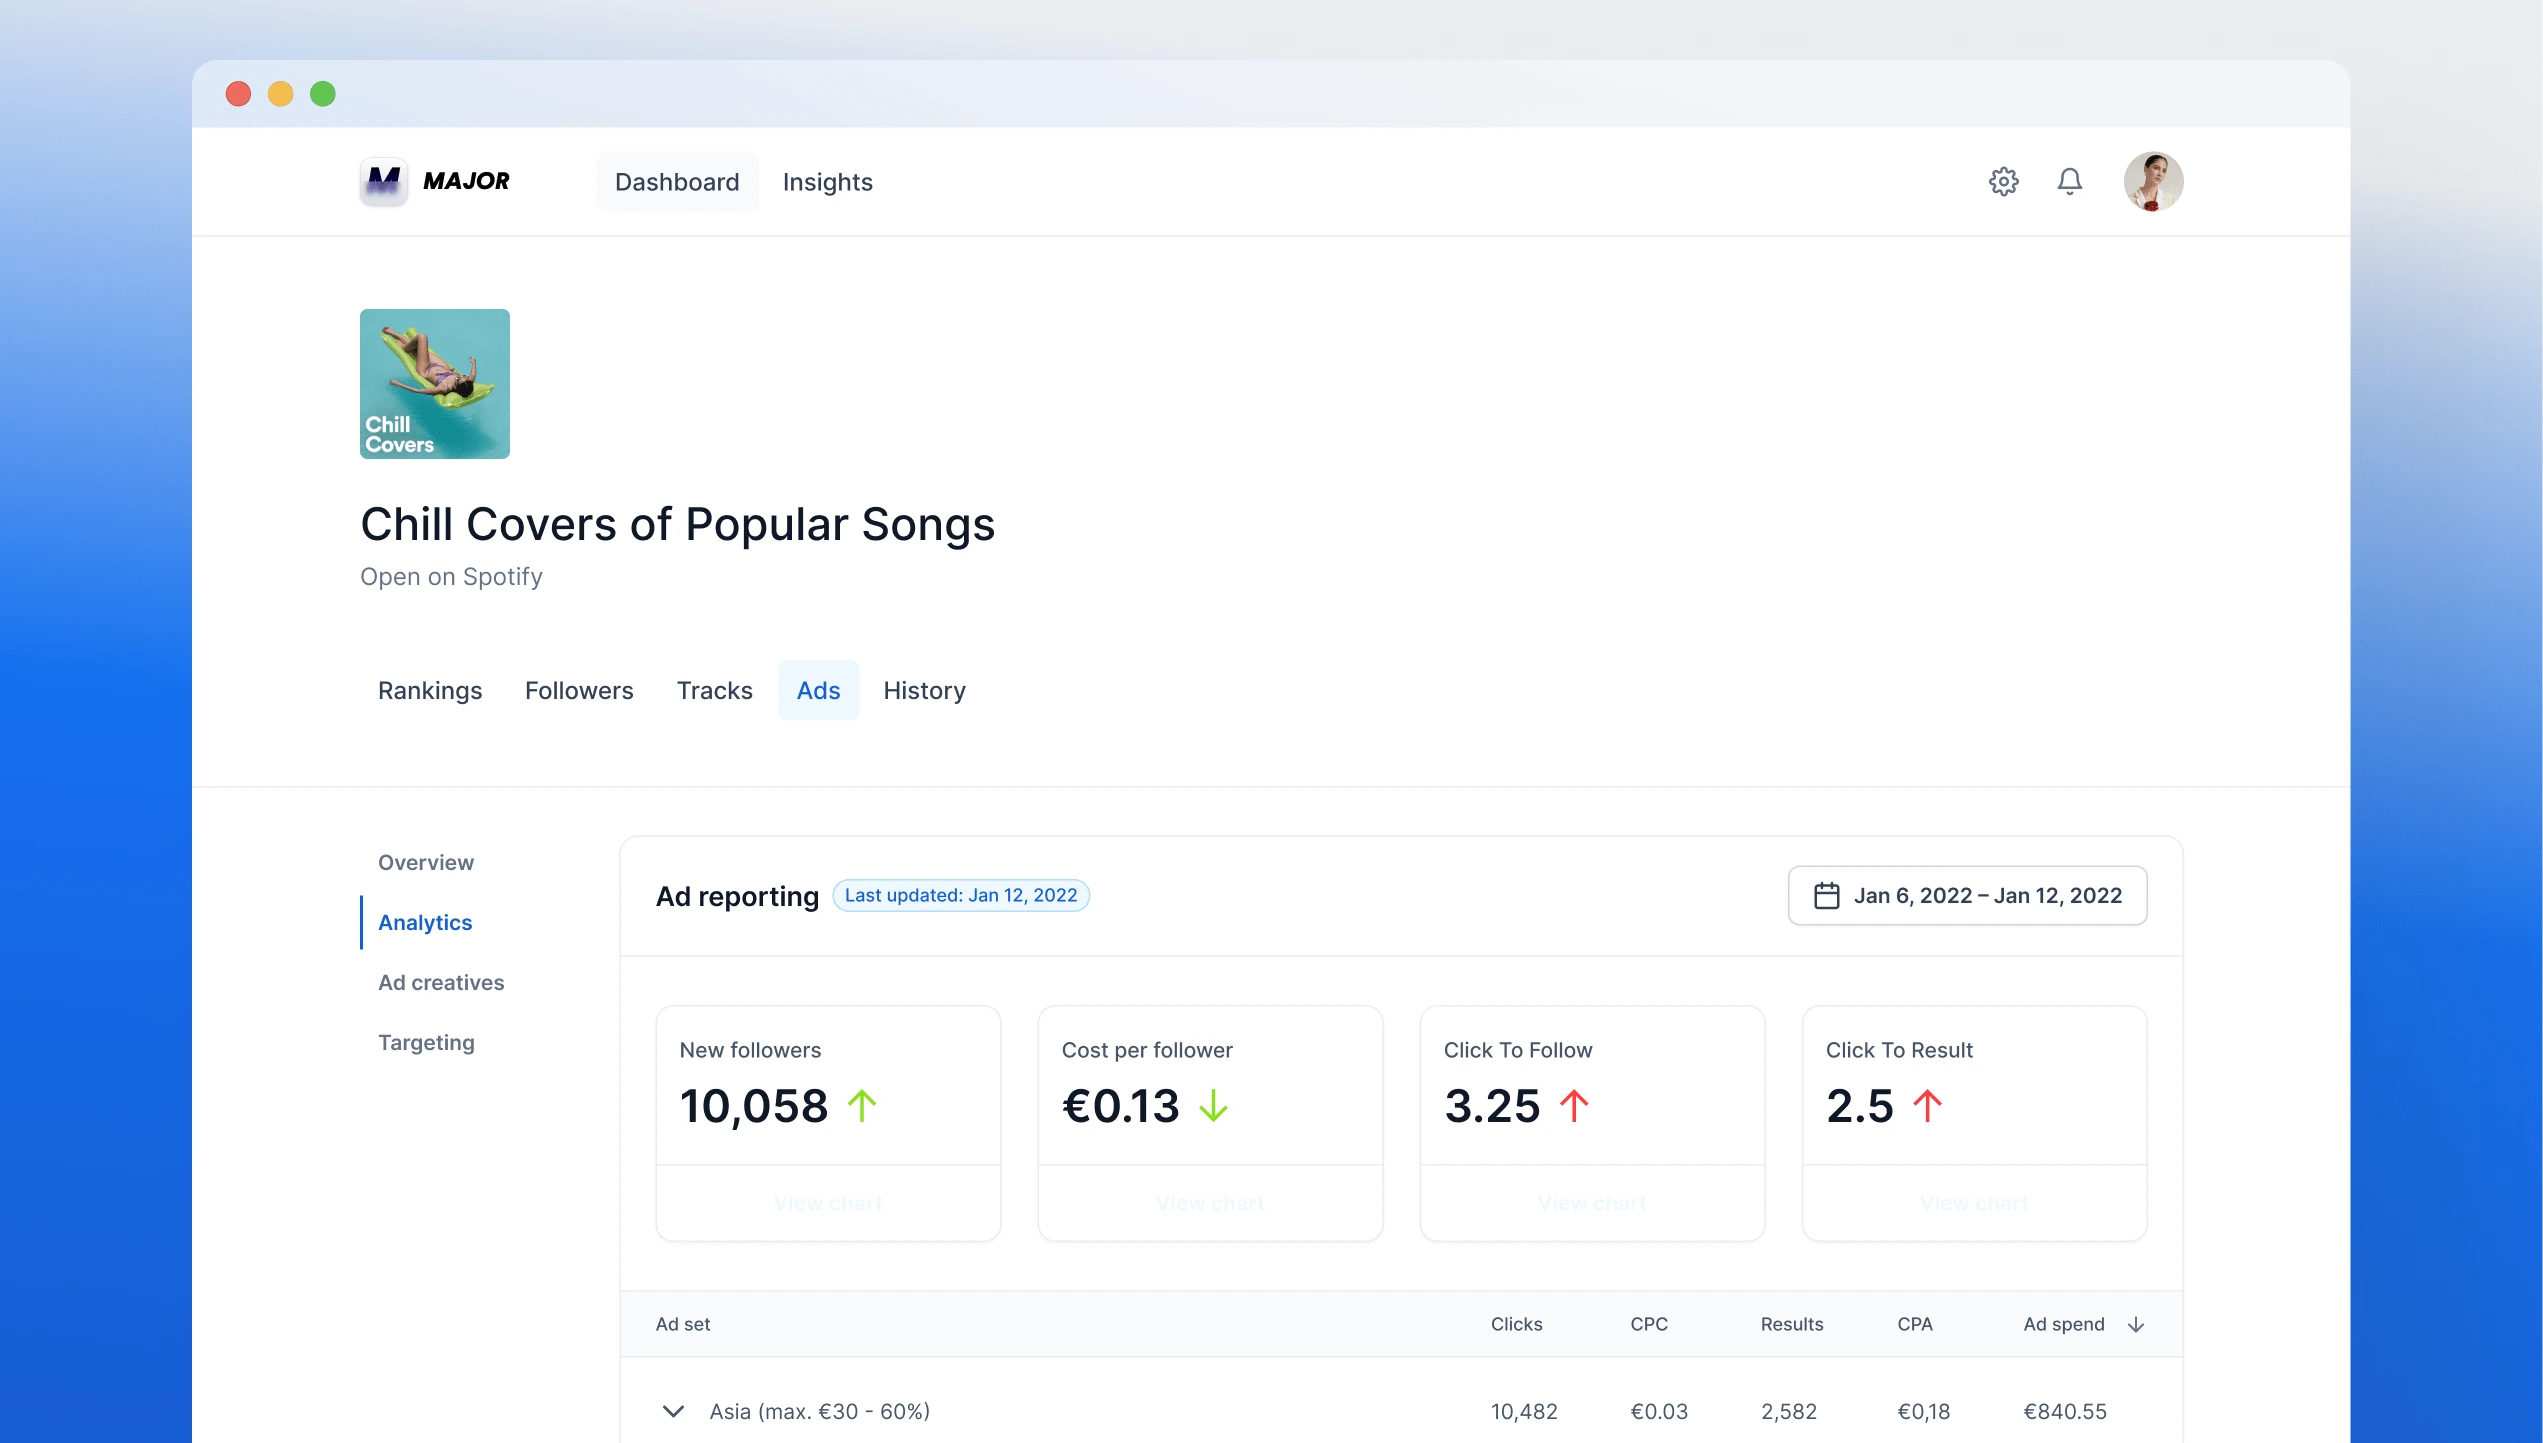
Users could choose playlists and target countries. The platform collected daily rankings, follower counts, and campaign data across 186 countries. It tracked 10 million data points each month.
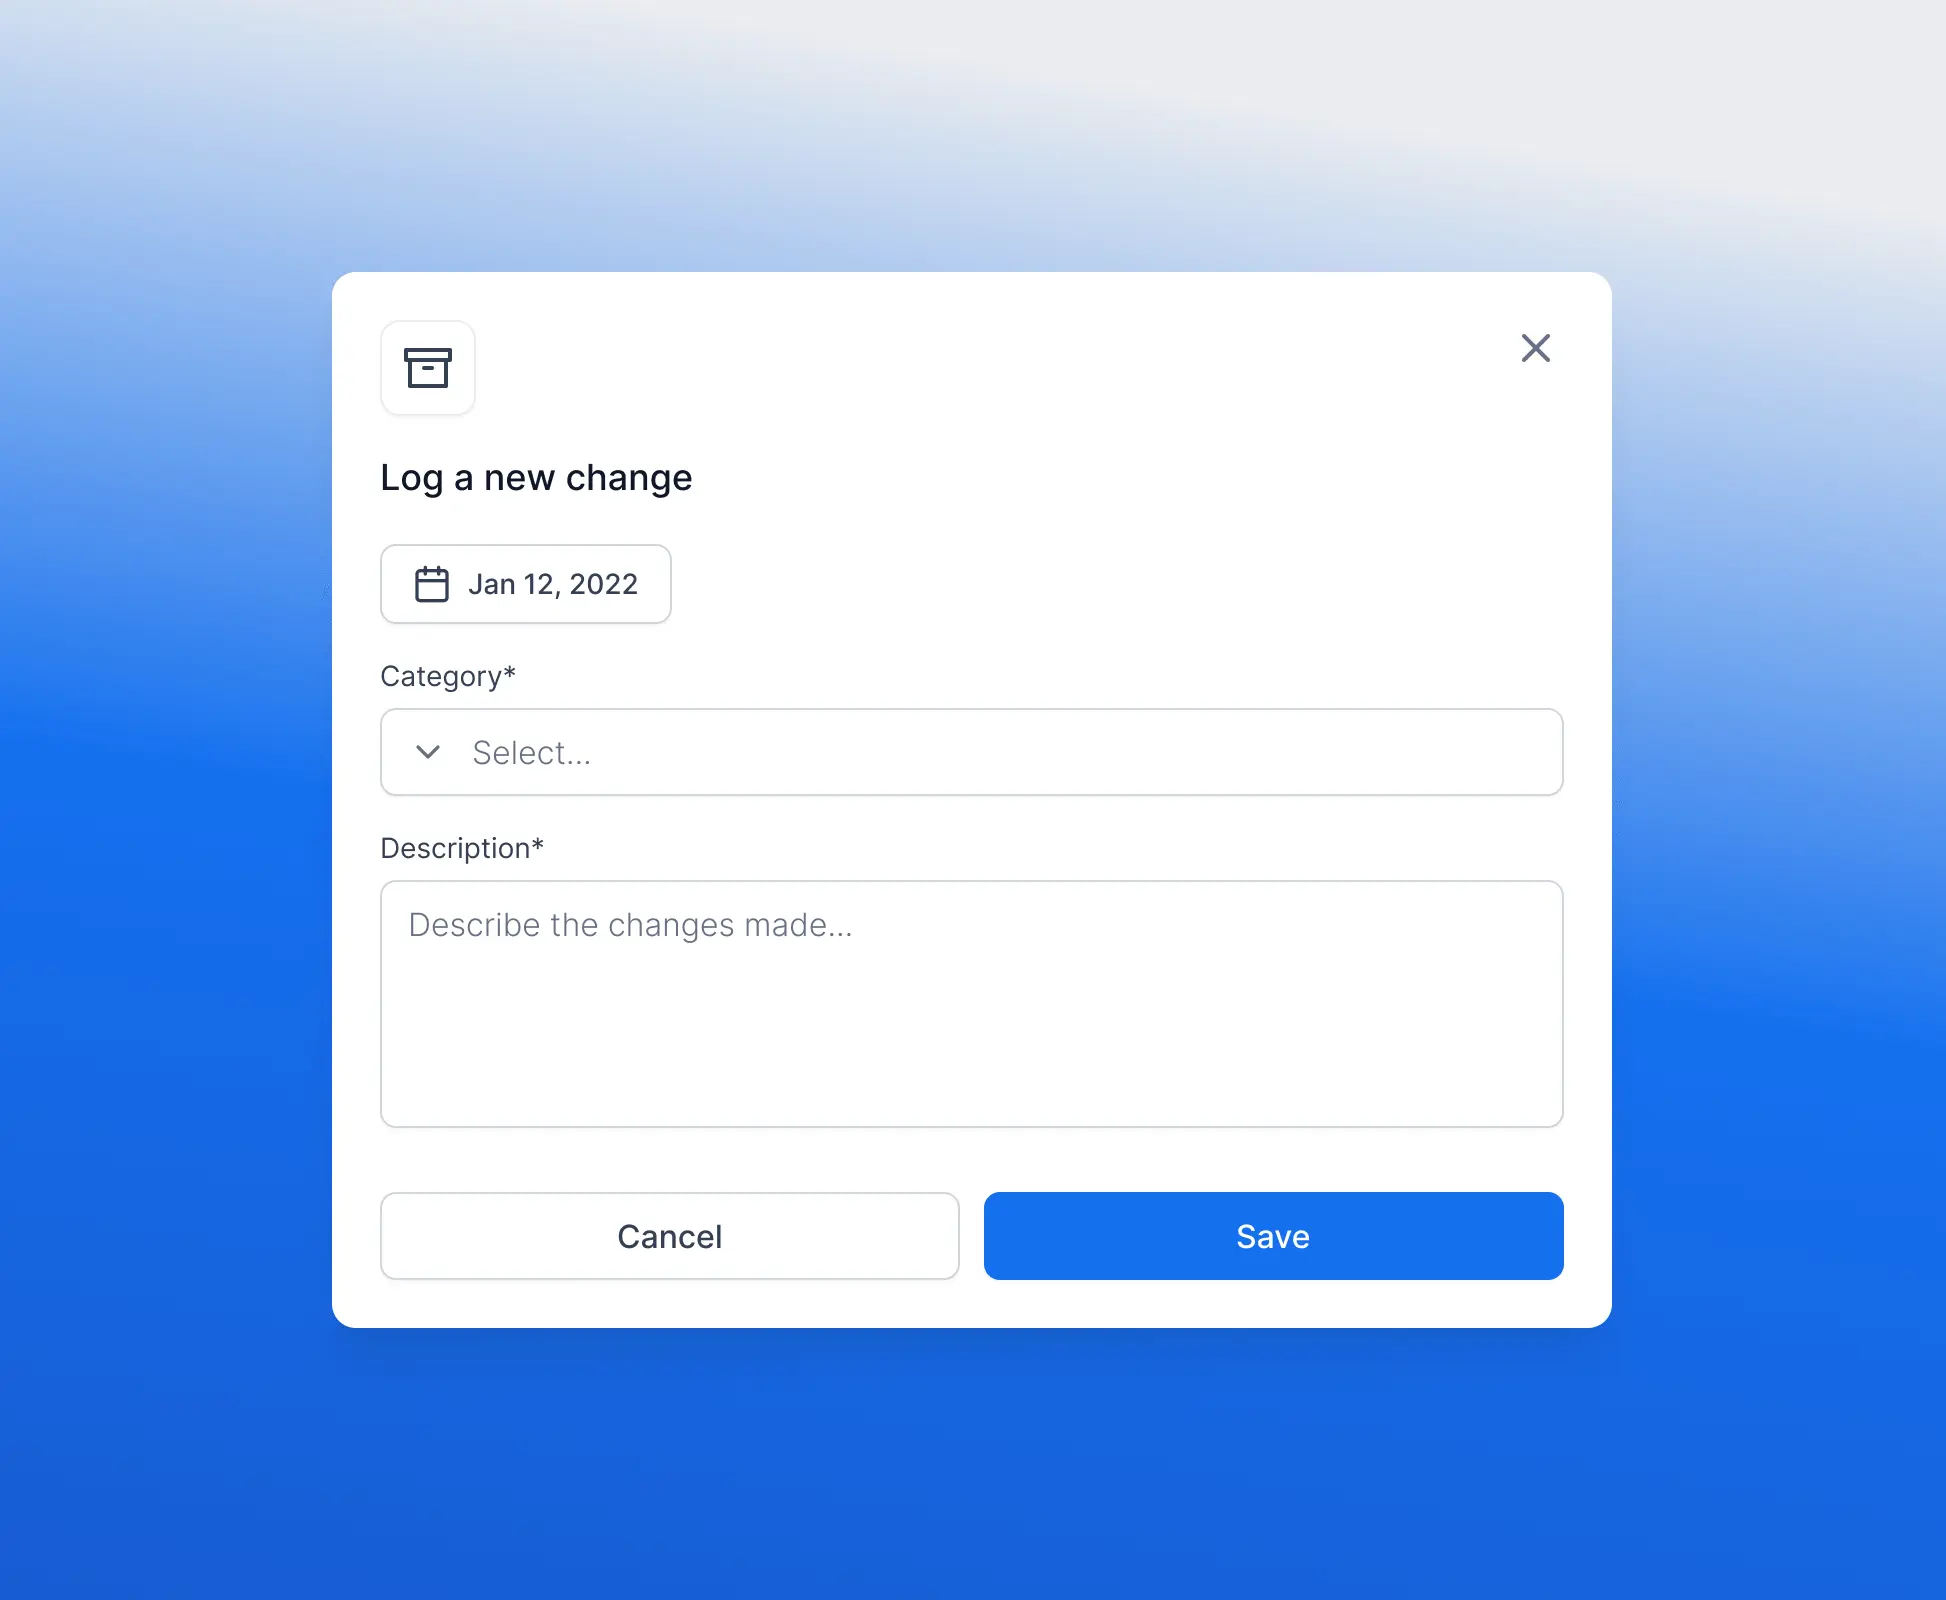
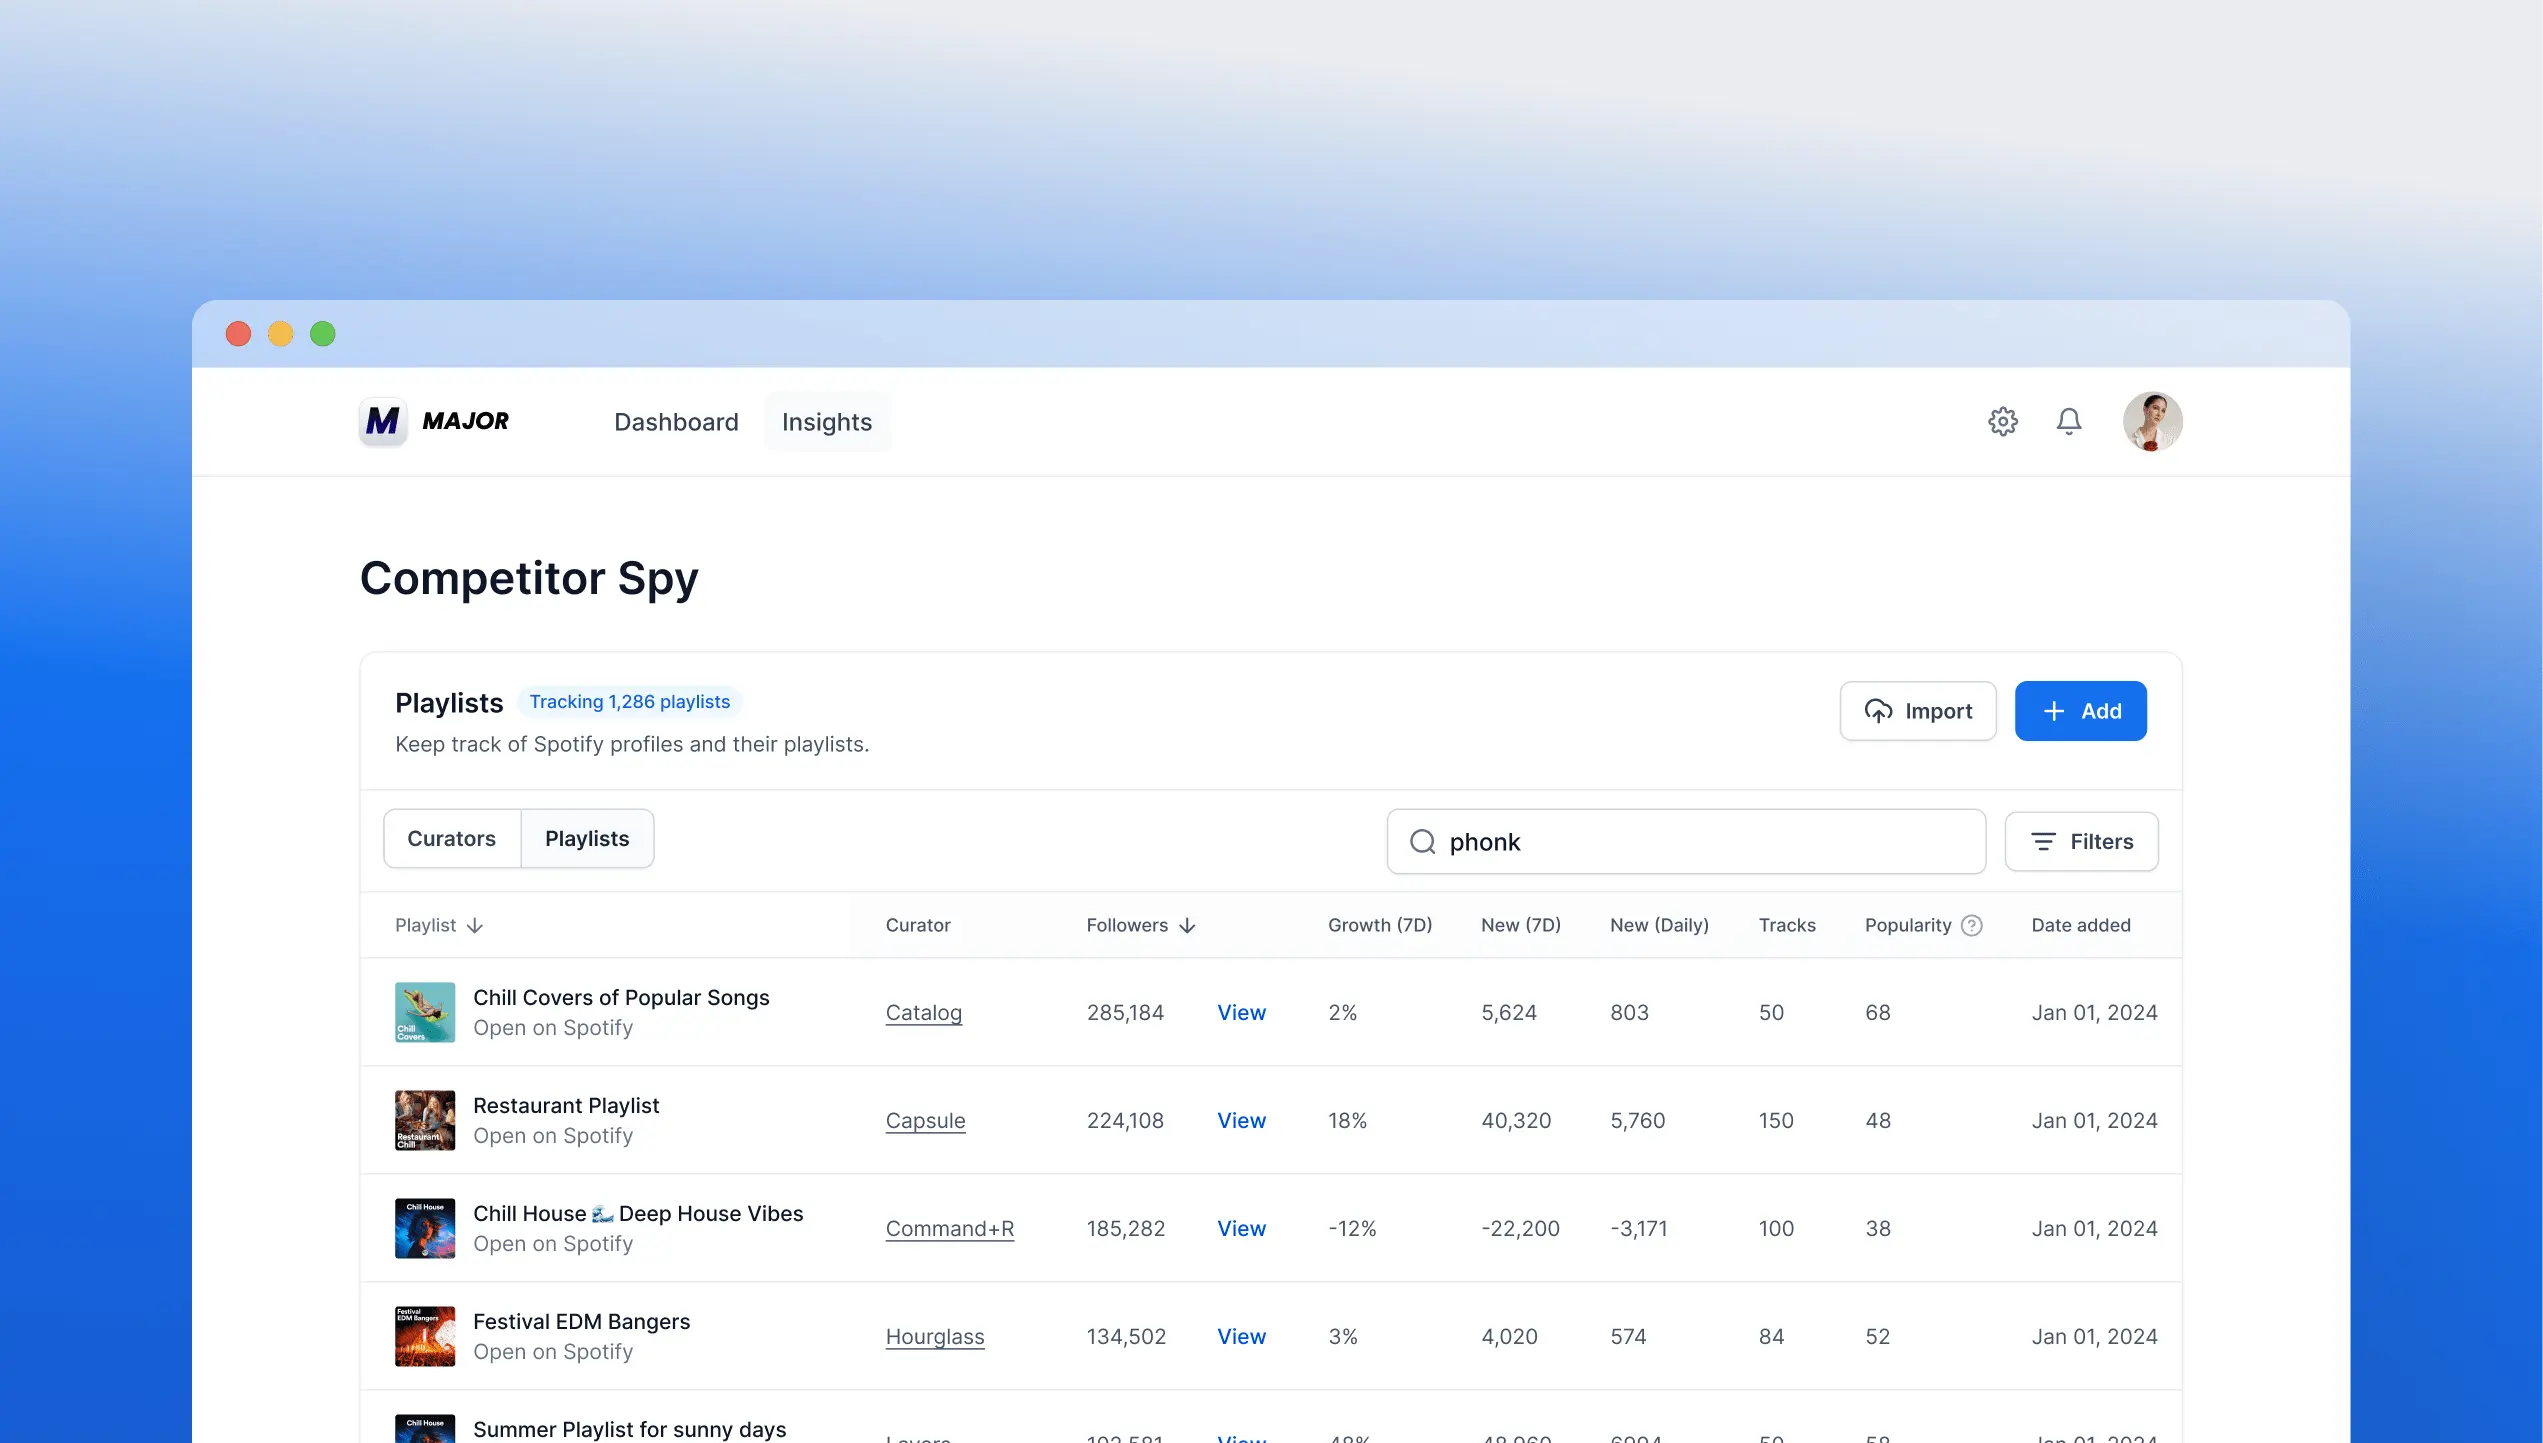
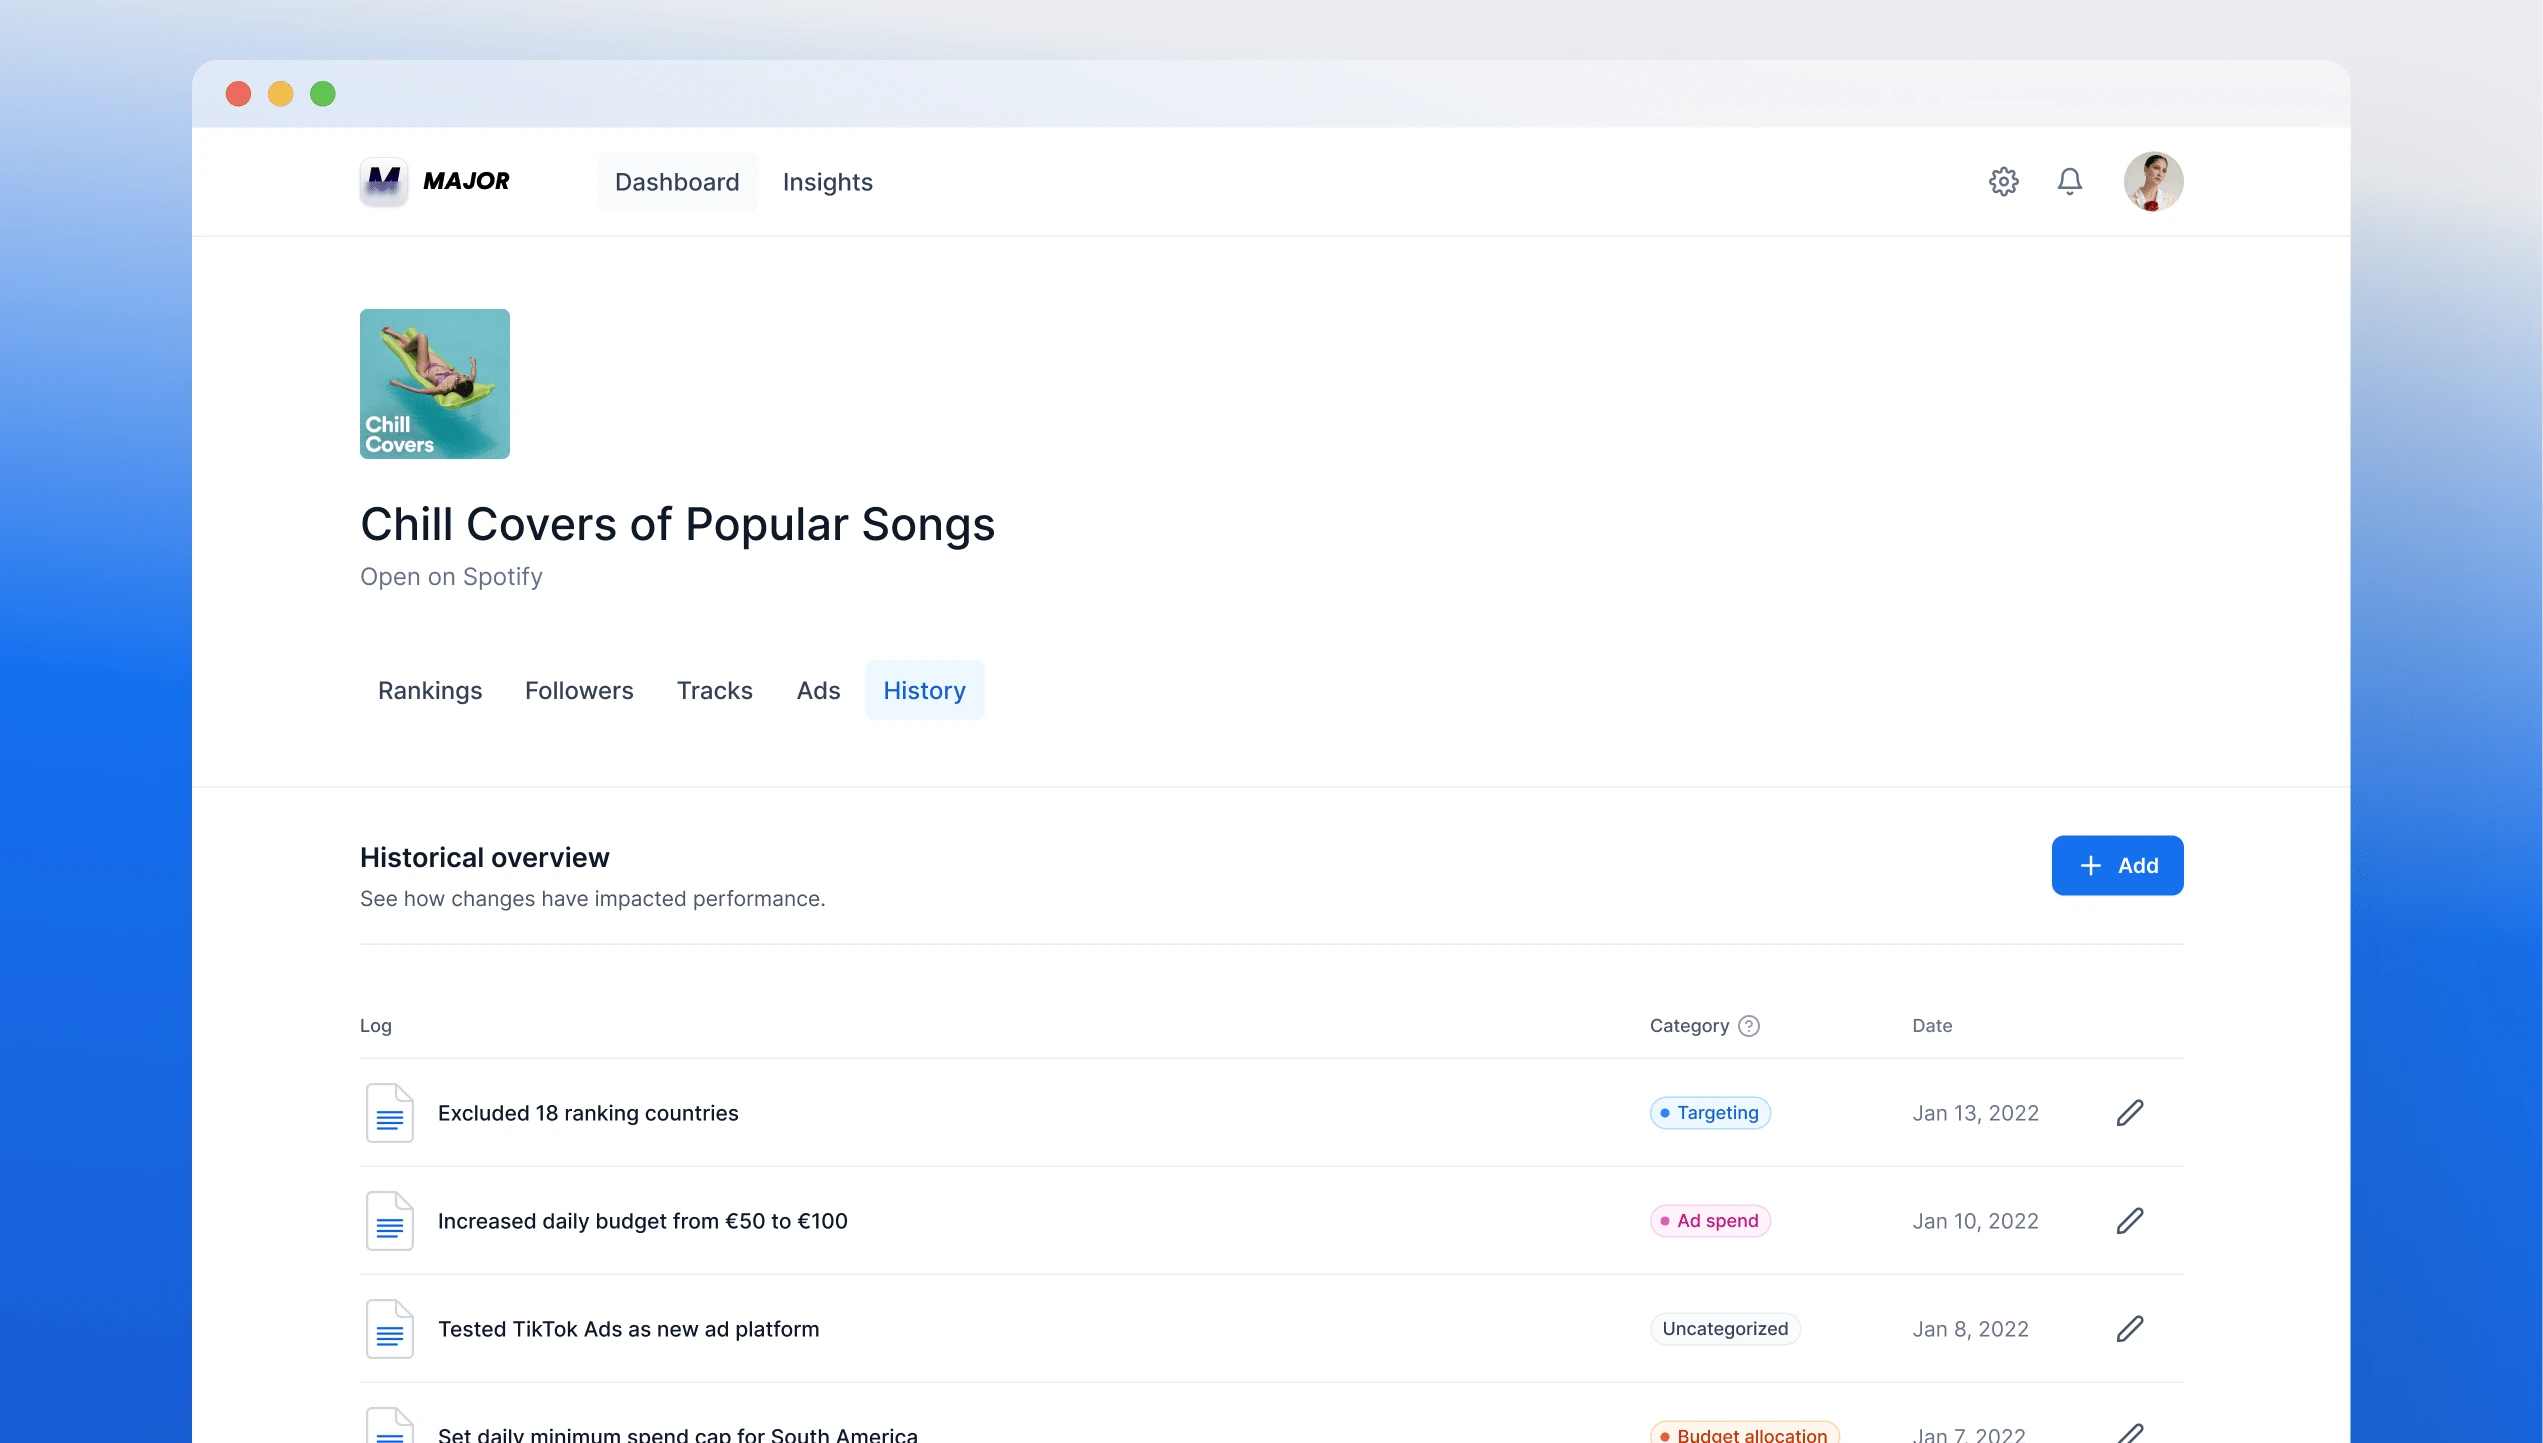
We also added change notes and linked them to playlist performance. This helped clients see how tests in campaigns, keywords, and markets related to their results. A later tool, Competitor Spy, used the data to track competitor playlists.
Result
Reporting time fell from 40 hours to under 2
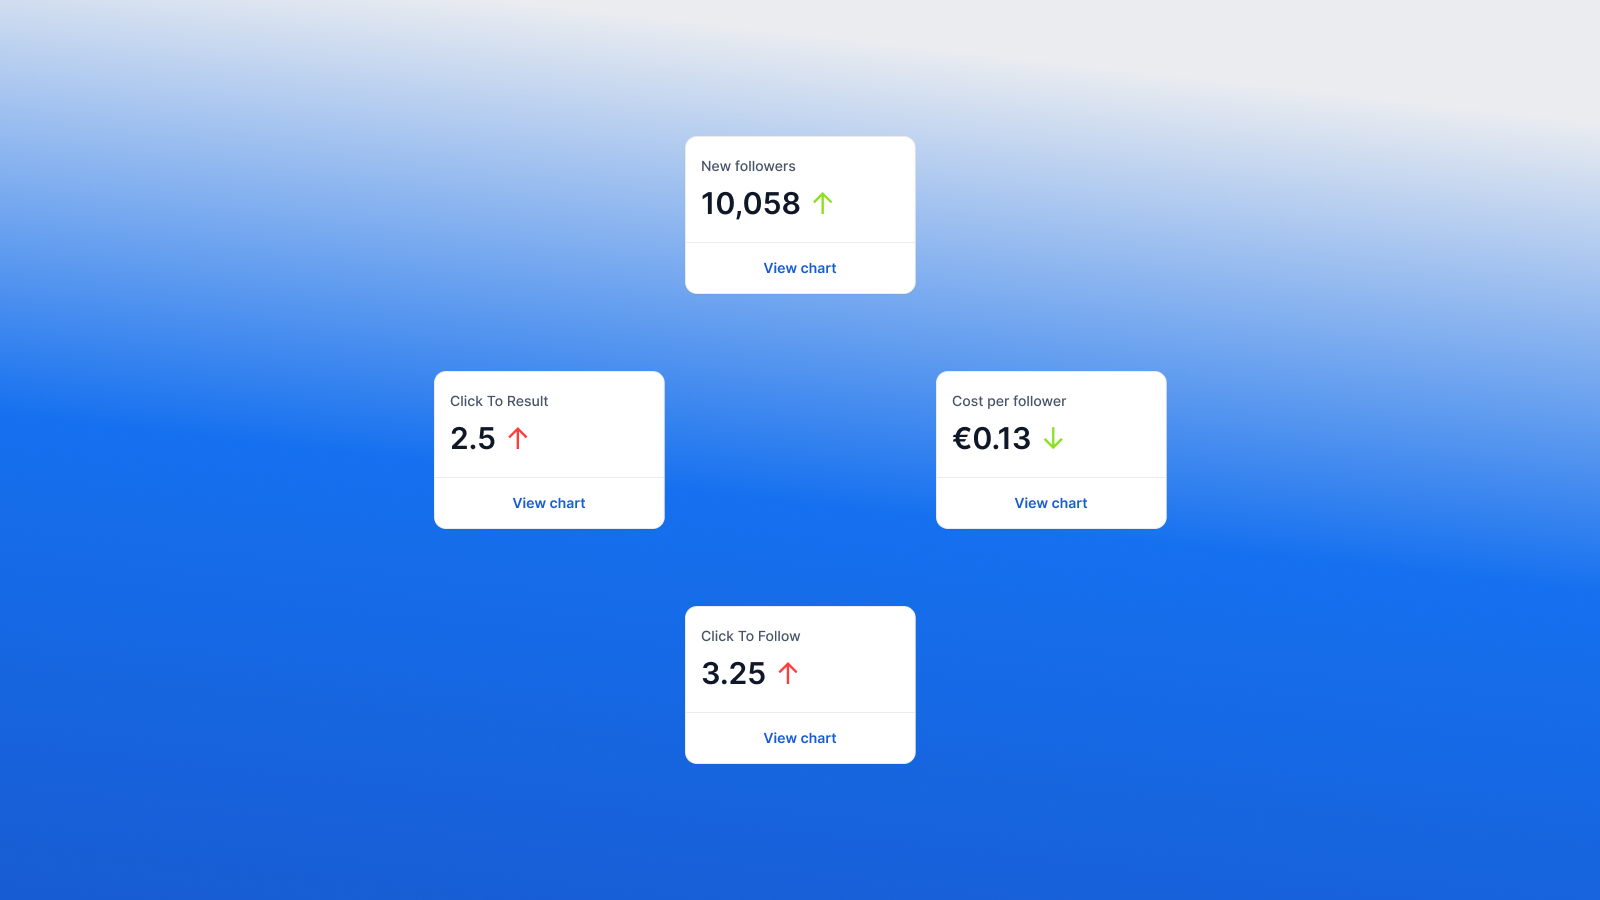
Monthly reporting and analysis per client fell from 40 hours to under 2. The platform tracked 10 million data points per month across 186 countries, so Major could expand reporting without adding the same manual work for each market.
Reflection
Make reporting useful for the next decision
The platform did more than collect data. Connecting campaign changes with playlist performance helped clients understand how their work affected results. That made the reporting useful for planning the next campaign.