A two-sided EV charging marketplace
Redesigning the driver's journey, from sign-up to a charge worth paying for

- Timeline
- Dec 2024 — Jan 2026
- Impact
- ~60% less onboarding friction
- Team
- FounderProduct Designer (me)Fractional UX ManagerUX ResearcherEngineers
- Skills
- UI DesignPrototypingUser TestingProduct StrategyHandoff
Overview
Introducing SplitEV
SplitEV is a Techstars-backed startup making EV charging accessible by letting hosts generate income from private chargers and letting drivers book safe, reliable, and nearby chargers. I joined as a fractional design partner to redesign the MVP.
Problem
Early flows were incomplete, so people dropped off before they found value.
Drivers couldn't reliably book chargers or tell what a subscription was worth, key flows were broken or circular, and onboarding took too long.
“There's a lot of info here so it'll take a while for me to make a decision.”
Design challenge
How might we unify SplitEV into one coherent system that real users can test and engineers can actually build?
Strategy
Test early, fix fast, and rebuild the driver's core loop.
We ran rounds of user testing to uncover friction early, iterate fast, and validate improvements. Over more than a year, through dozens of iterations, we rebuilt how a driver signs up, finds and books a charger, and sees what they're saving.
Decisions
Onboarding
Onboarding was 200% longer than the industry average and was predicted to lead to high drop-off rates.
How should onboarding get people to value sooner?
I designed onboarding around progressive disclosure: ask only for what the next step needs. With a UX manager, we reduced onboarding friction by nearly 60%.
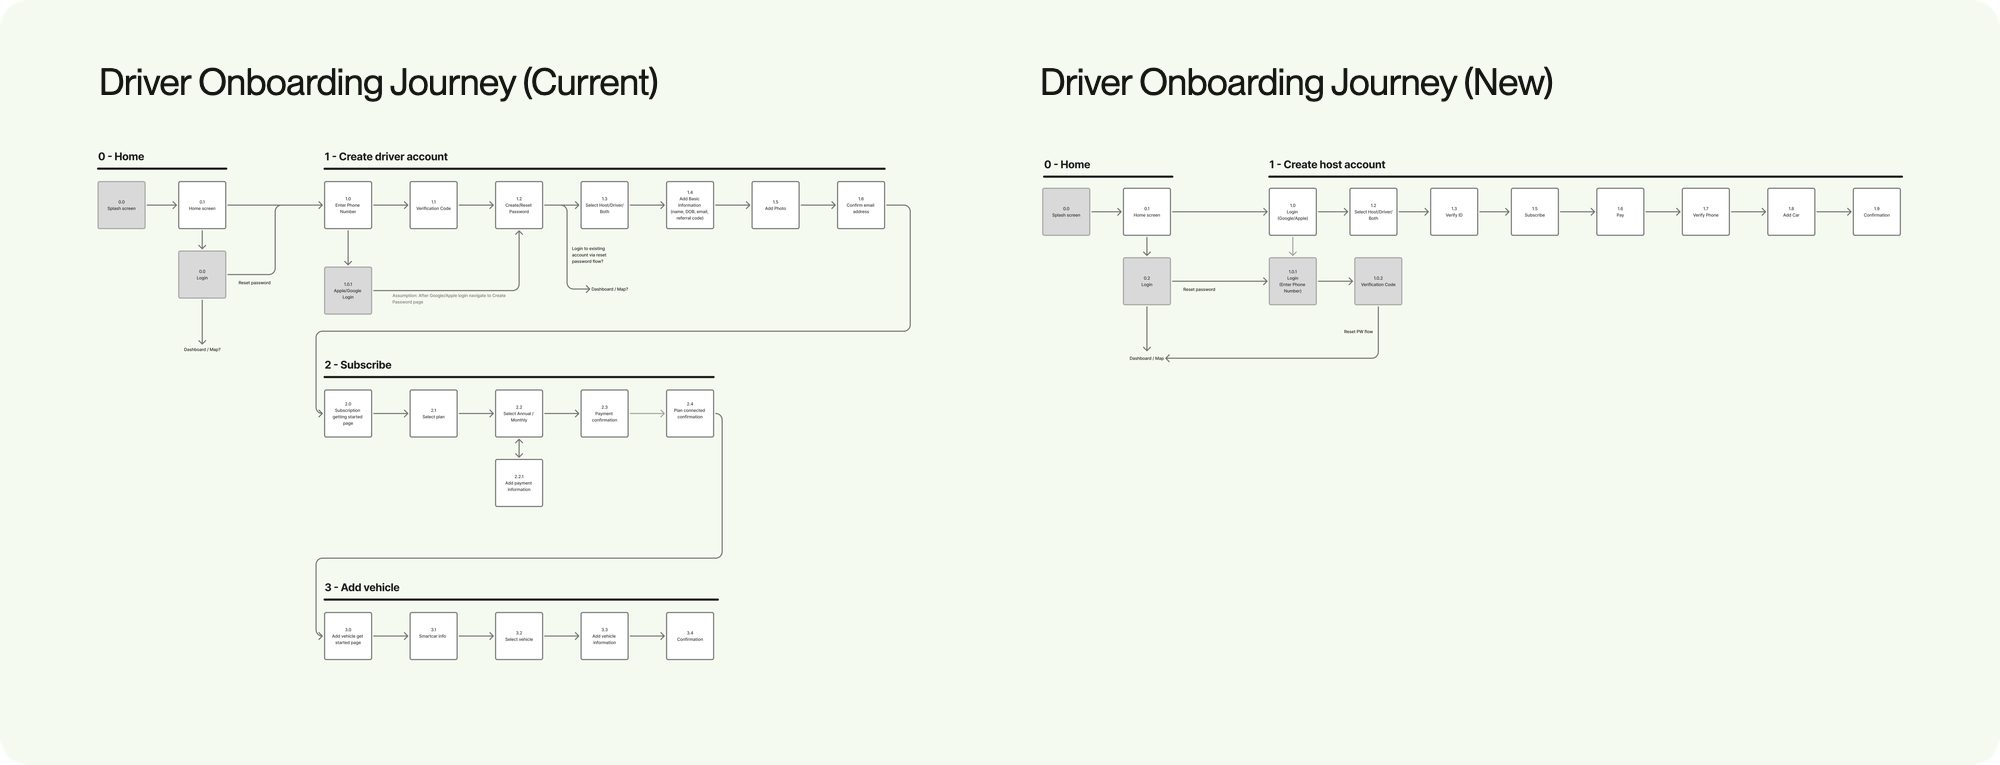
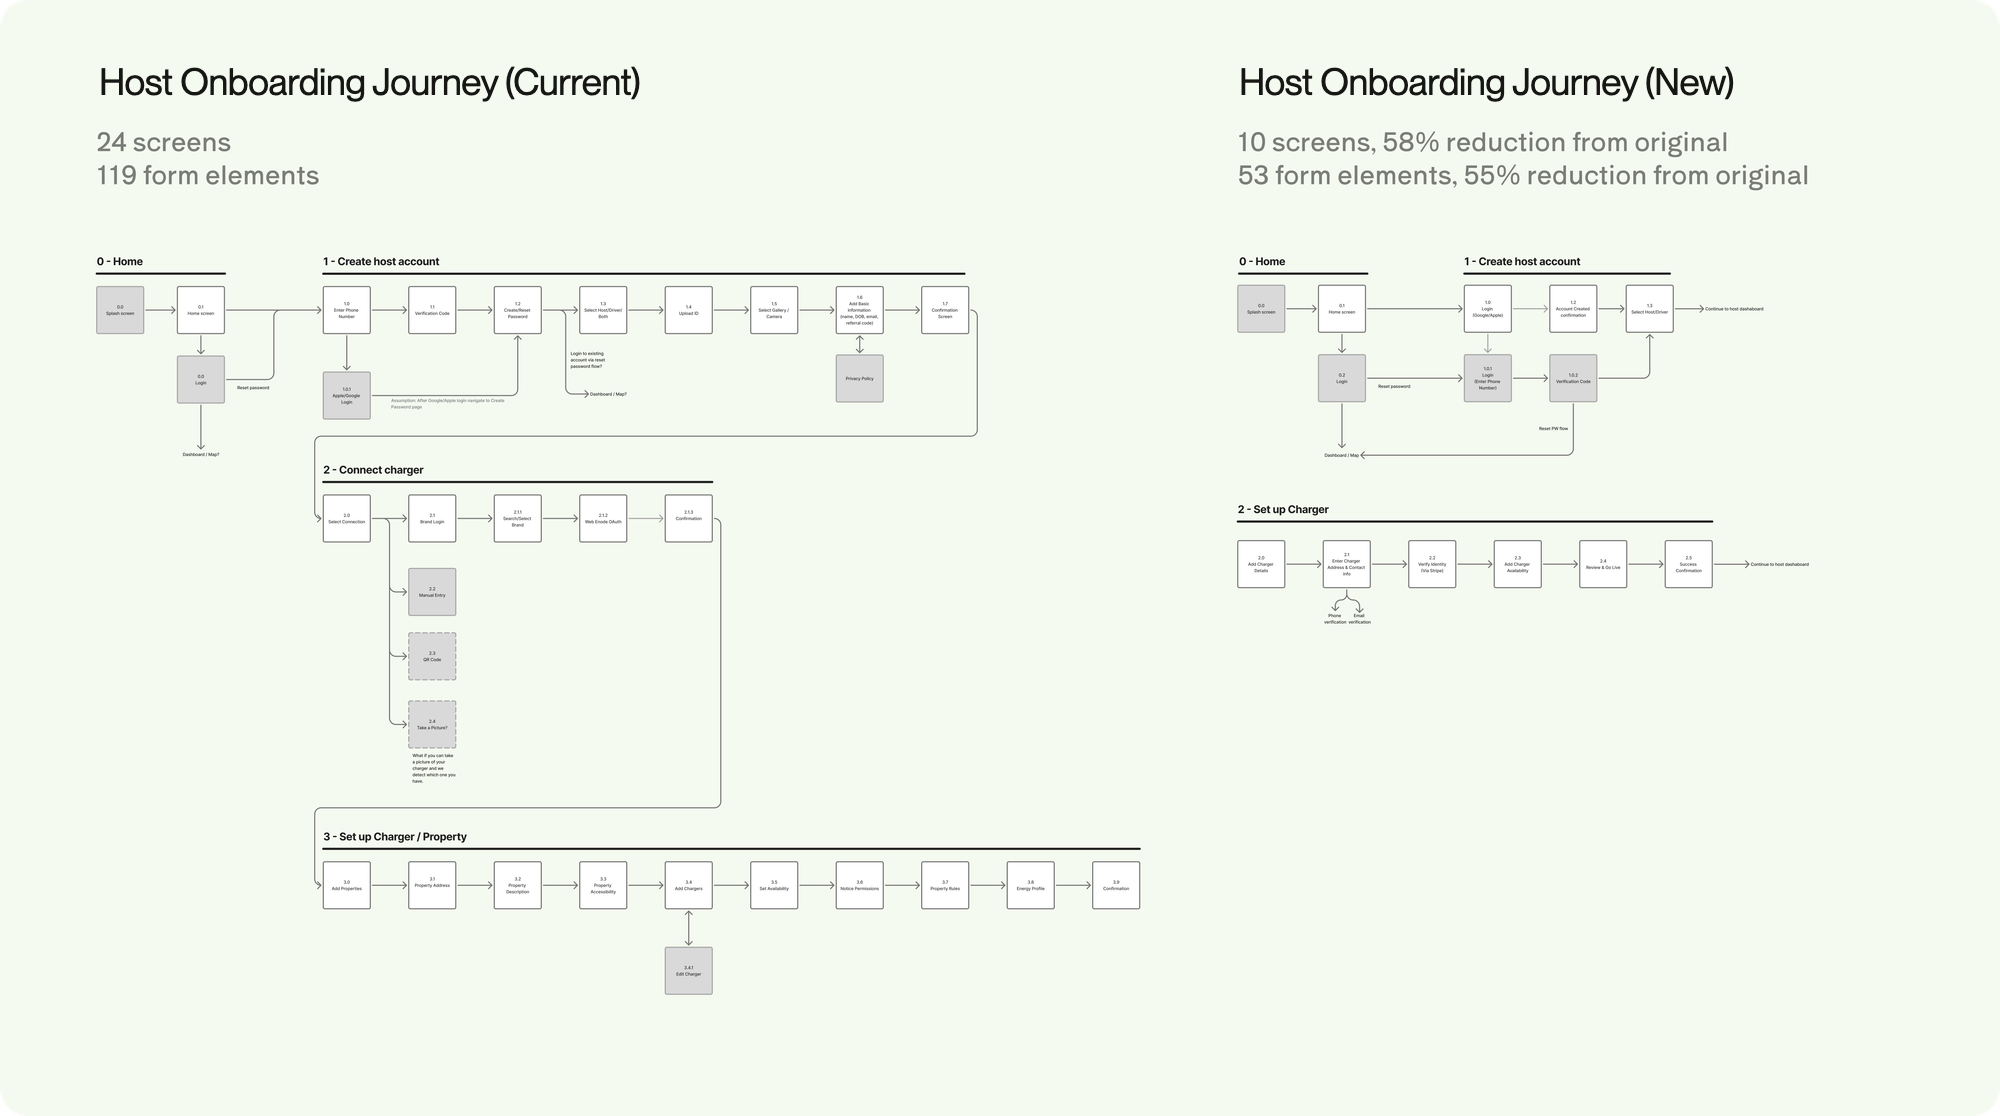
Progressive disclosure reduced cognitive overload and decreased time on task. Completion rates increased meaningfully, and users consistently reached activation on the first attempt.
Finding and booking a charger
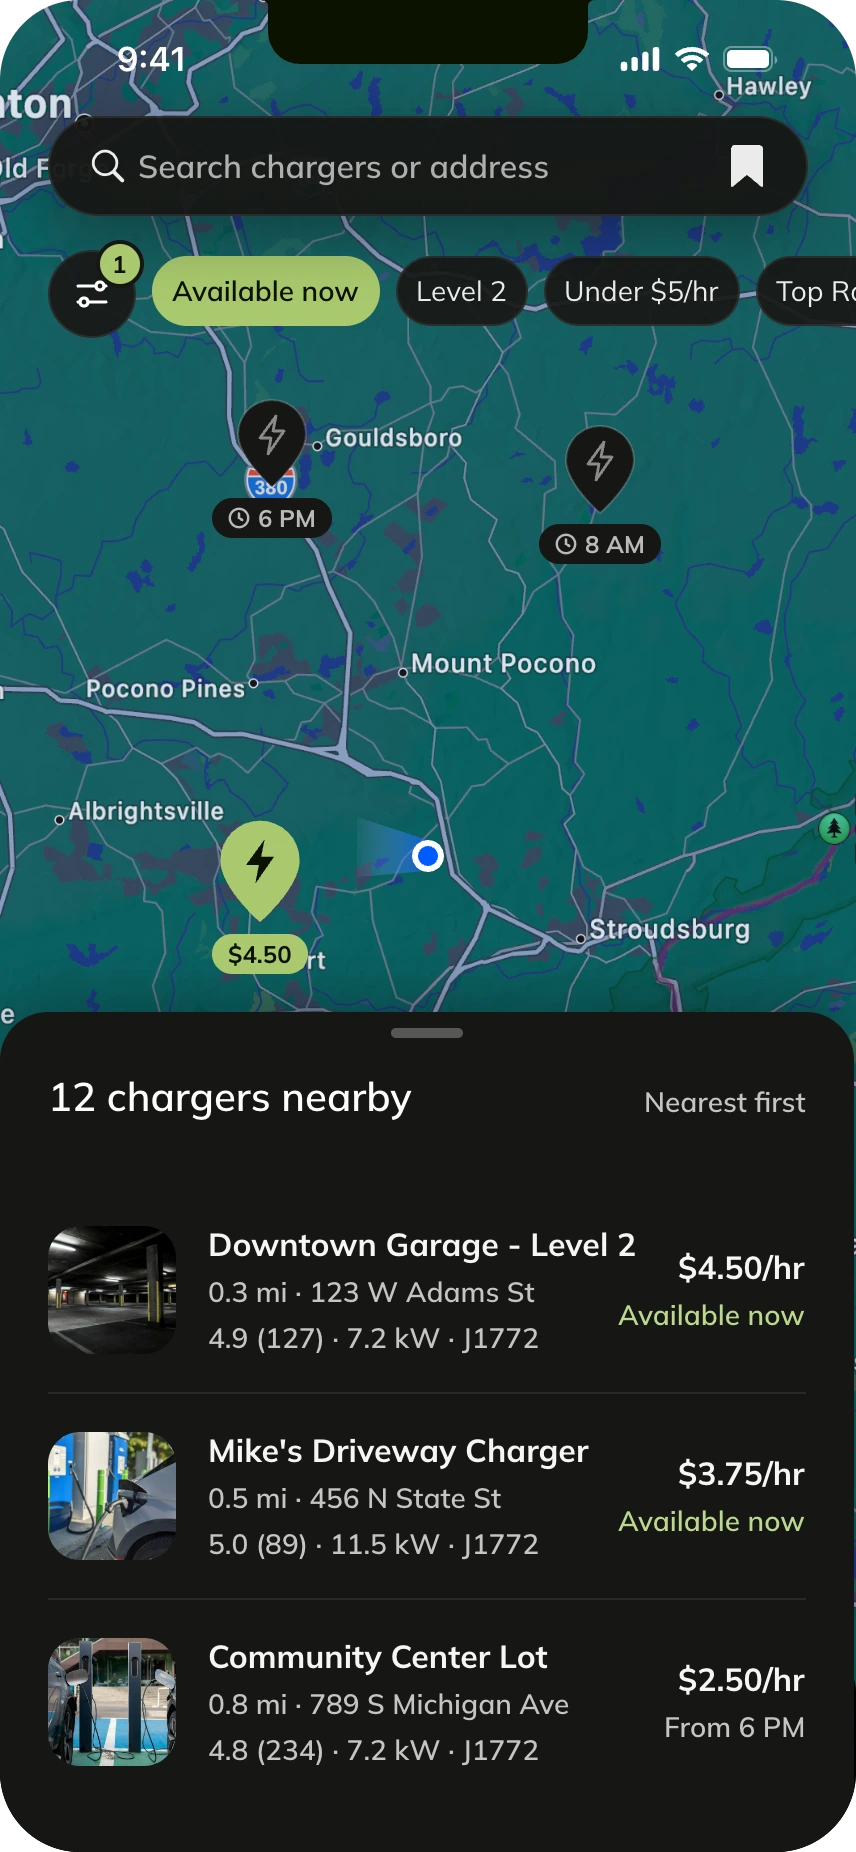
This user flow was incomplete and failed to surface key information needed to select a fitting station. By reducing friction in the Driver flow, we reinforced the high-retention charging loop that drives SplitEV's subscription revenue.
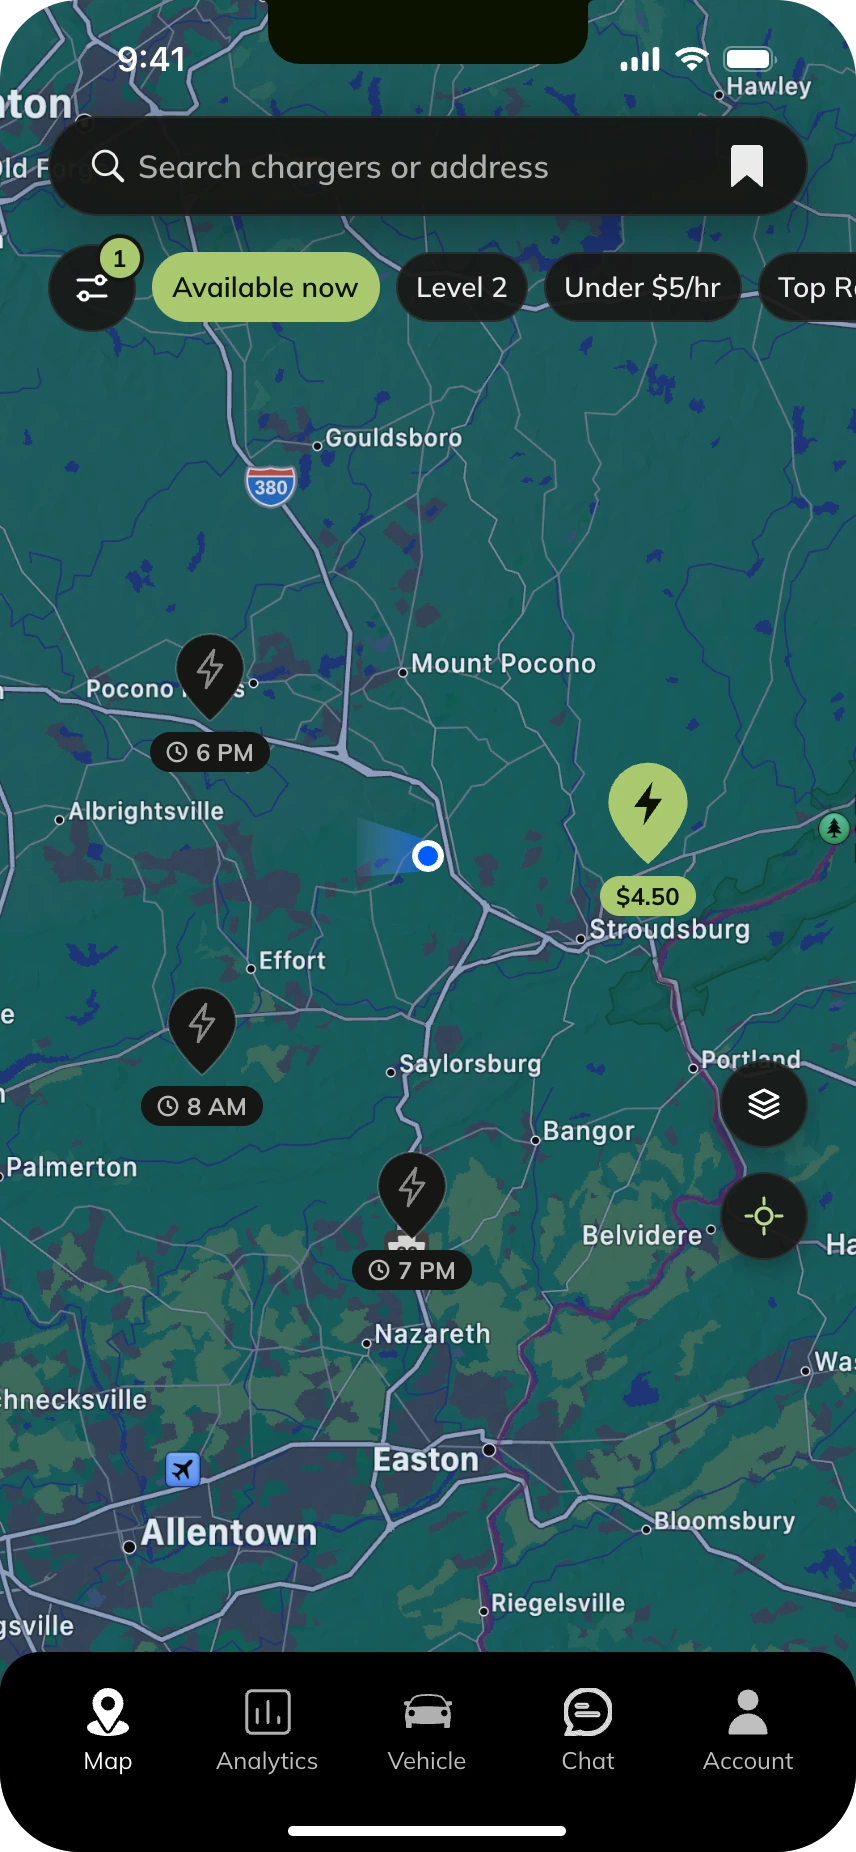
What should a pin tell a driver before they tap it?
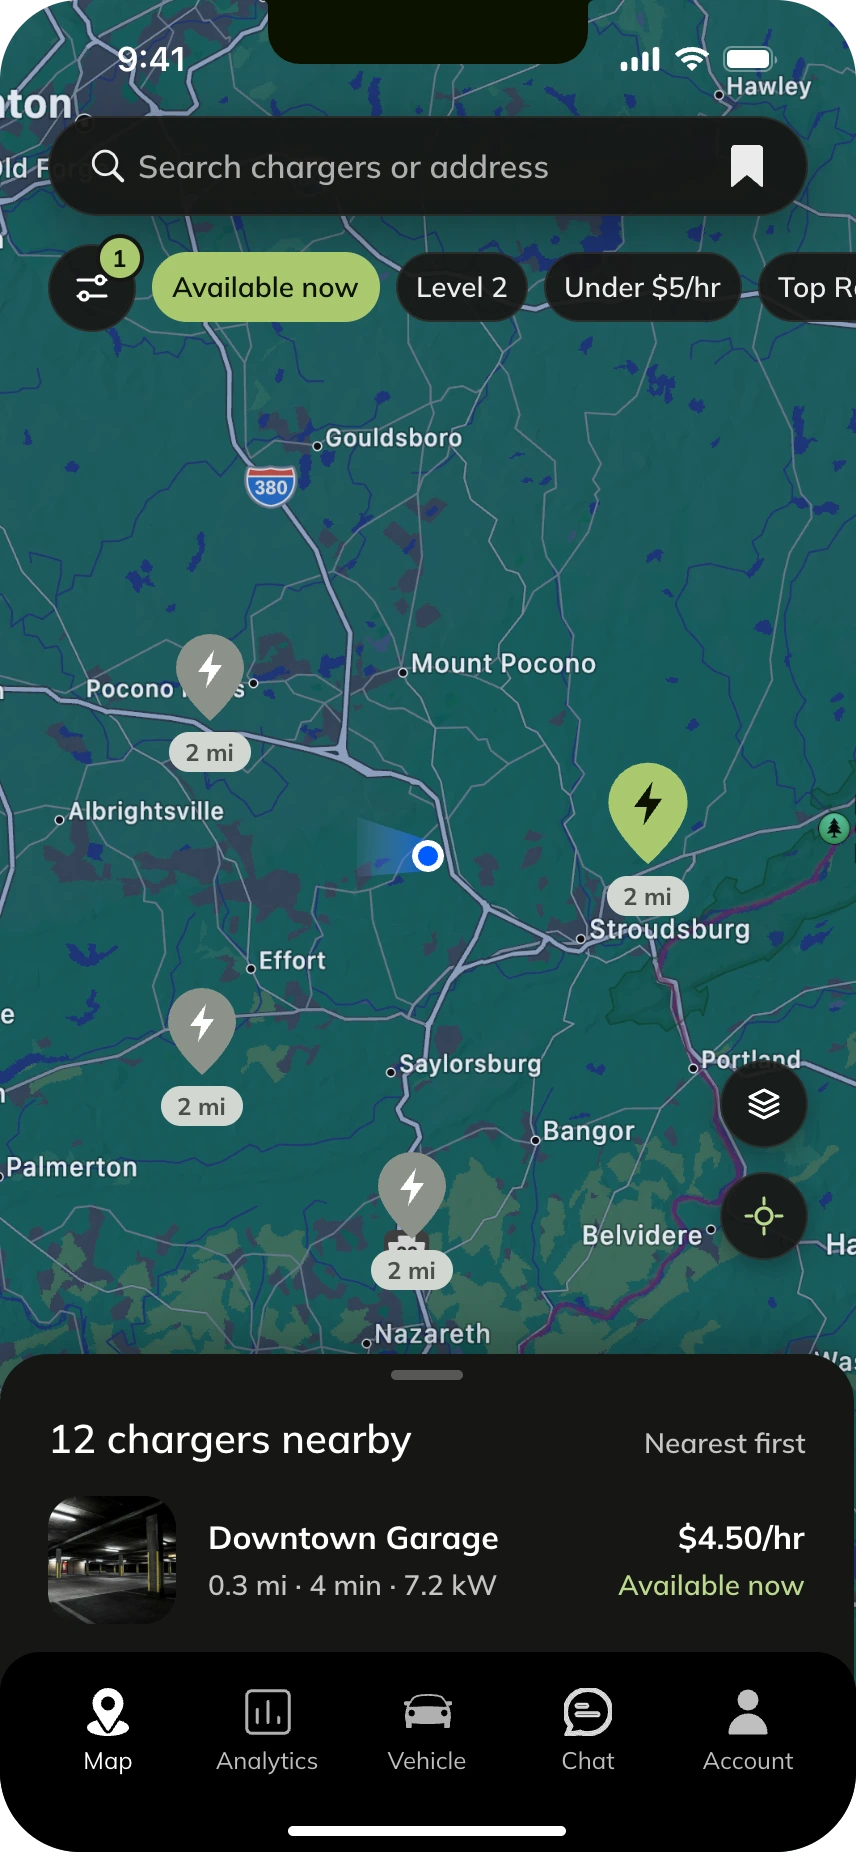
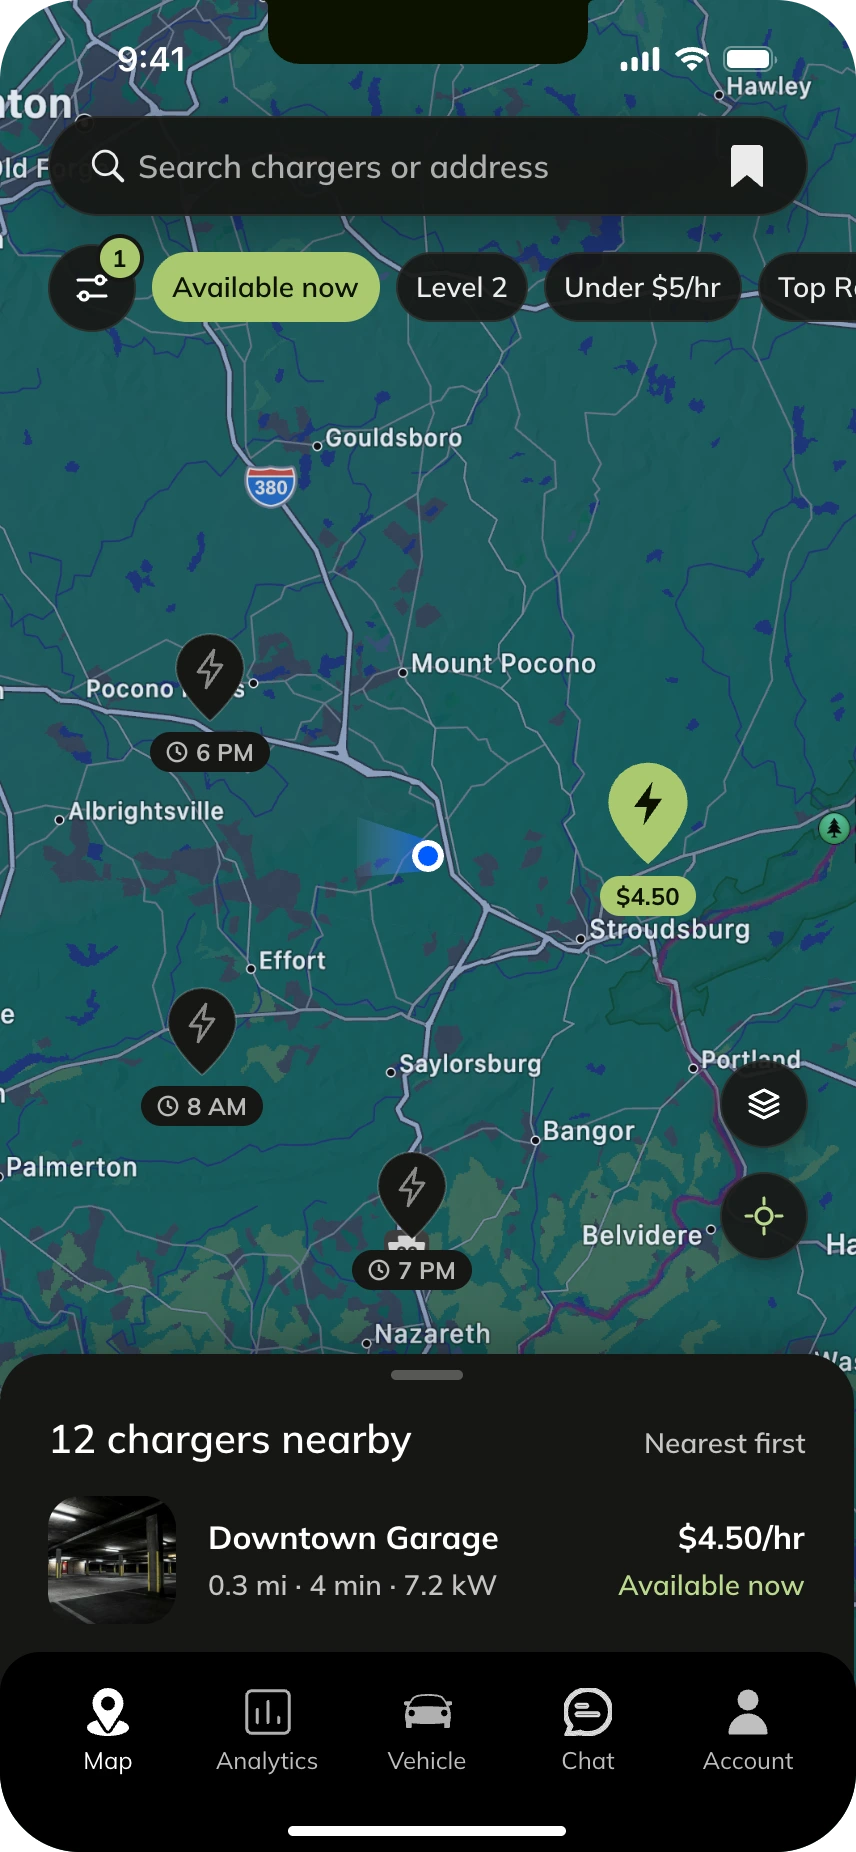
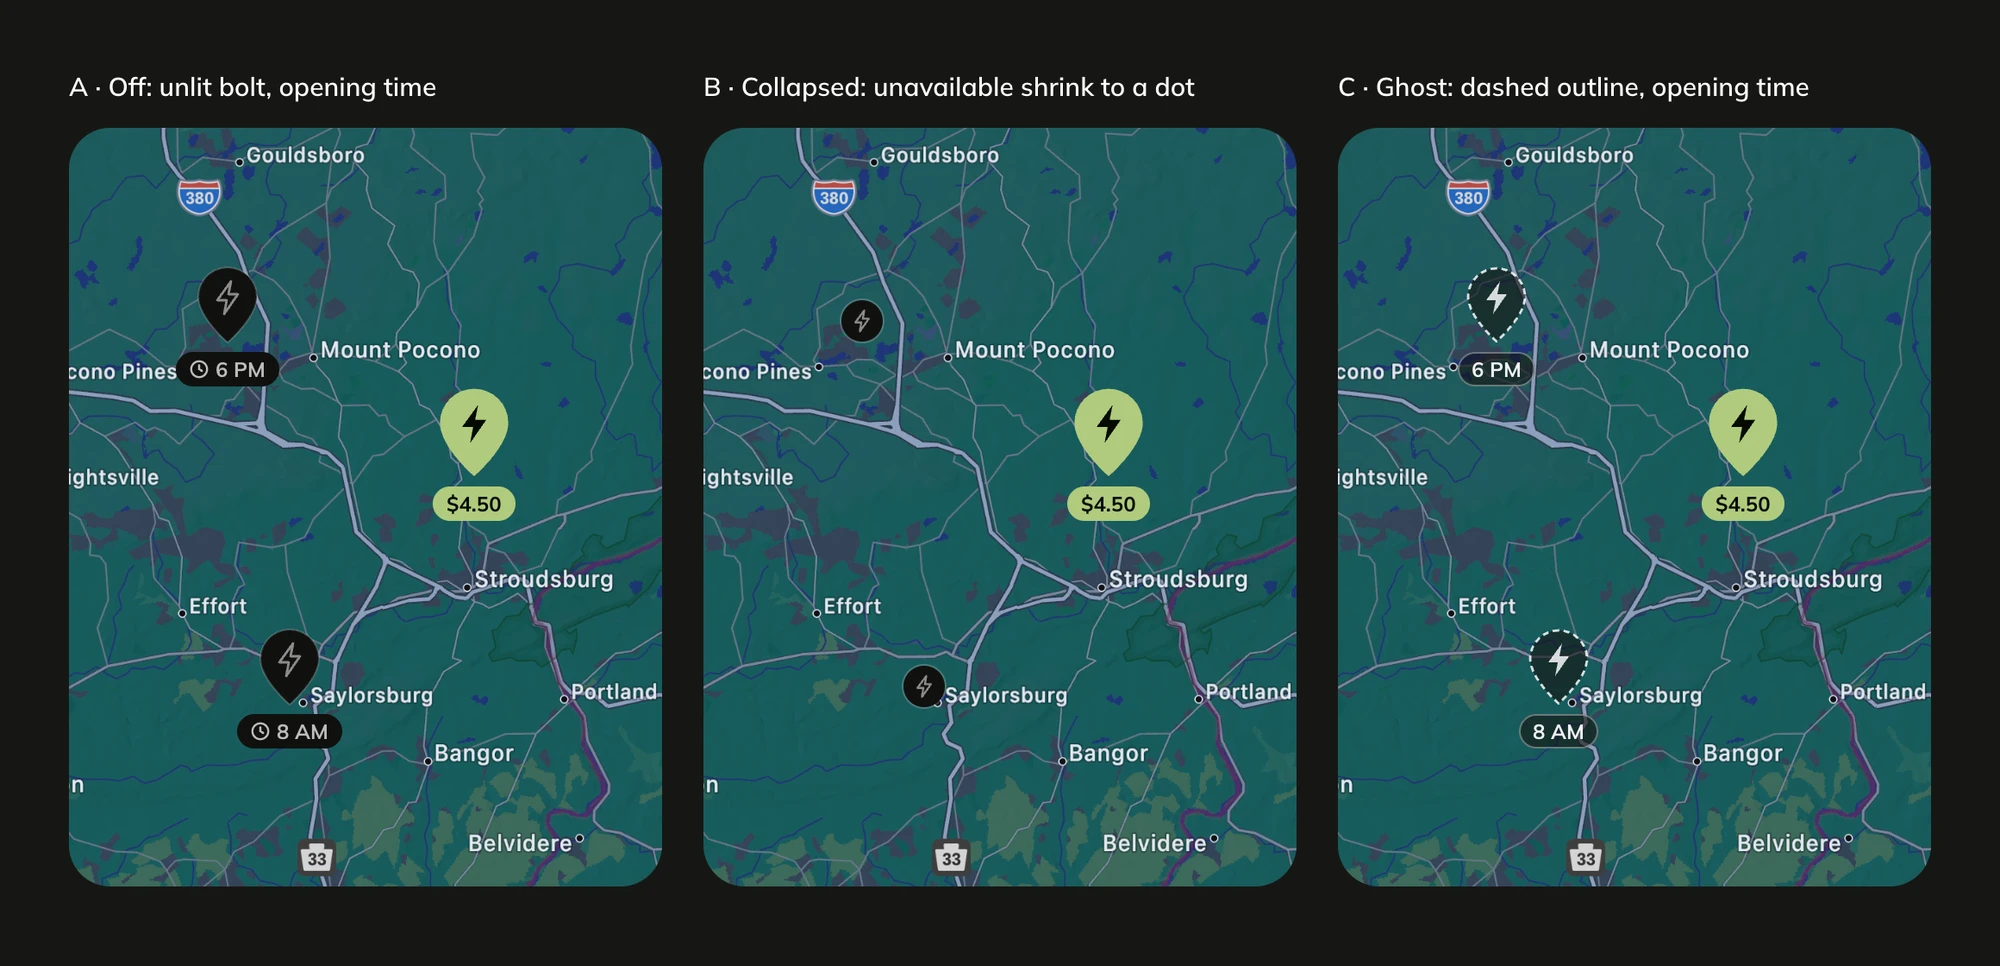
I designed available pins to show price, and unavailable pins to switch off and show when they open. The original pins showed distance from user location, so price and availability were invisible until a driver tapped on a charger. A grey pin also clashed with the teal map and read as broken, not closed.
Option A: Distance
Option B: Price
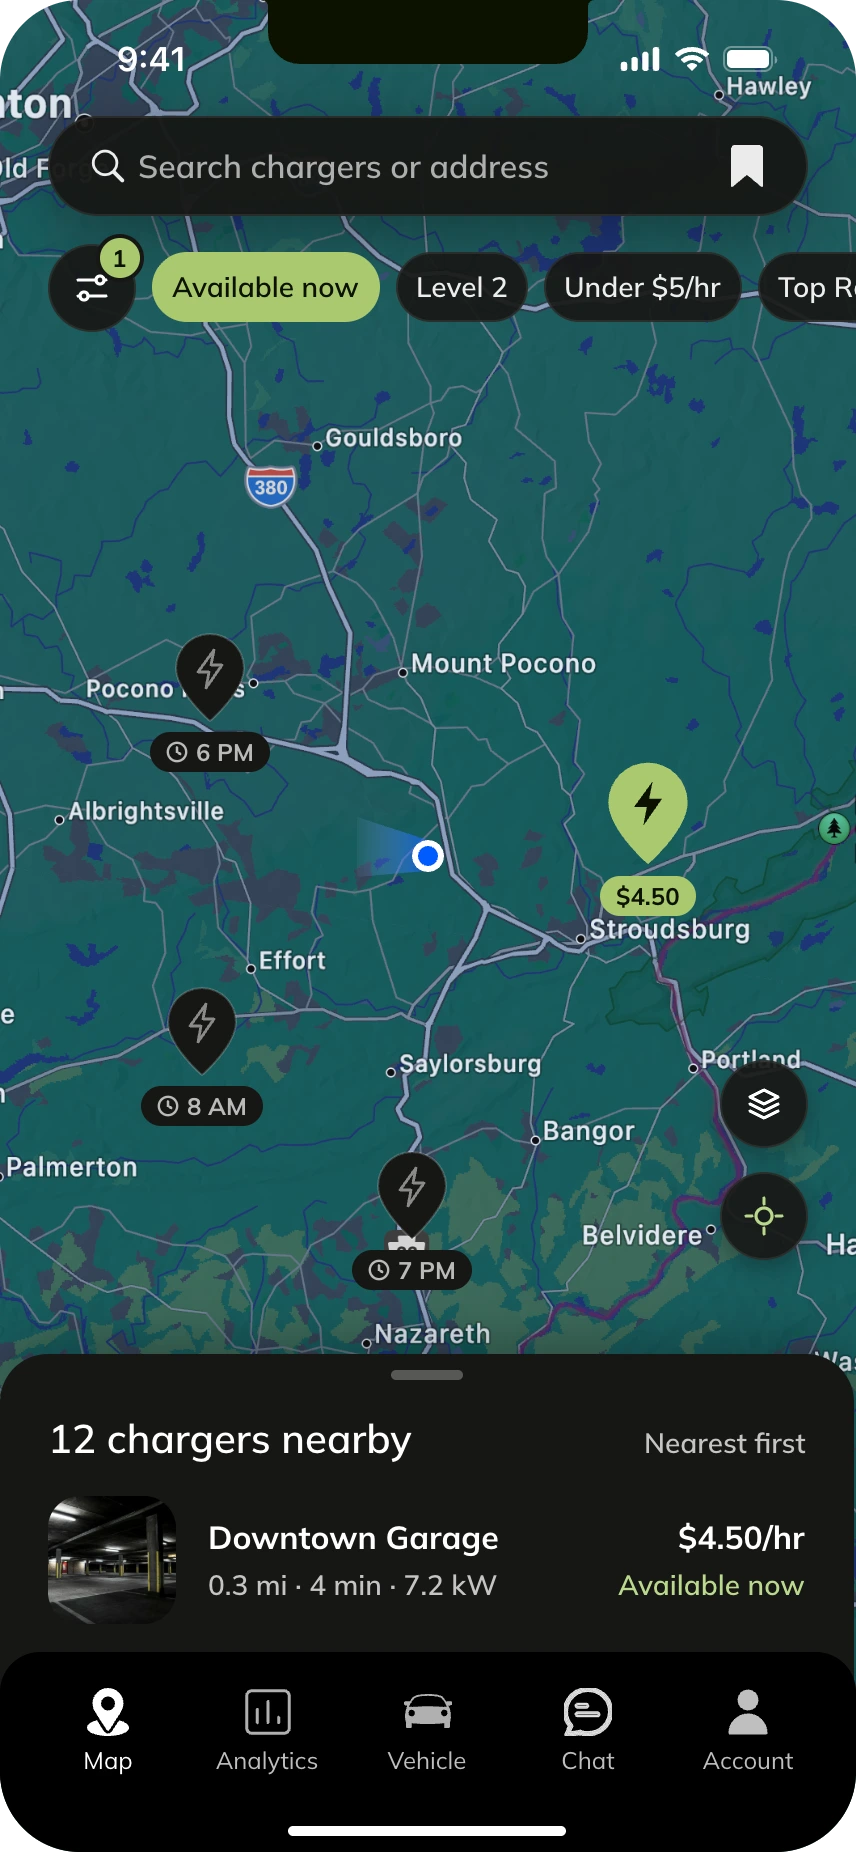
How should the map and the list work together?
I designed a peeking bottom sheet, showing the nearest charger to give drivers a quick choice without leaving the map. Meanwhile, the original was just the map. To see details or compare chargers, a driver had to tap pins one by one.
Option A: map only
Option B: peeking bottom sheet
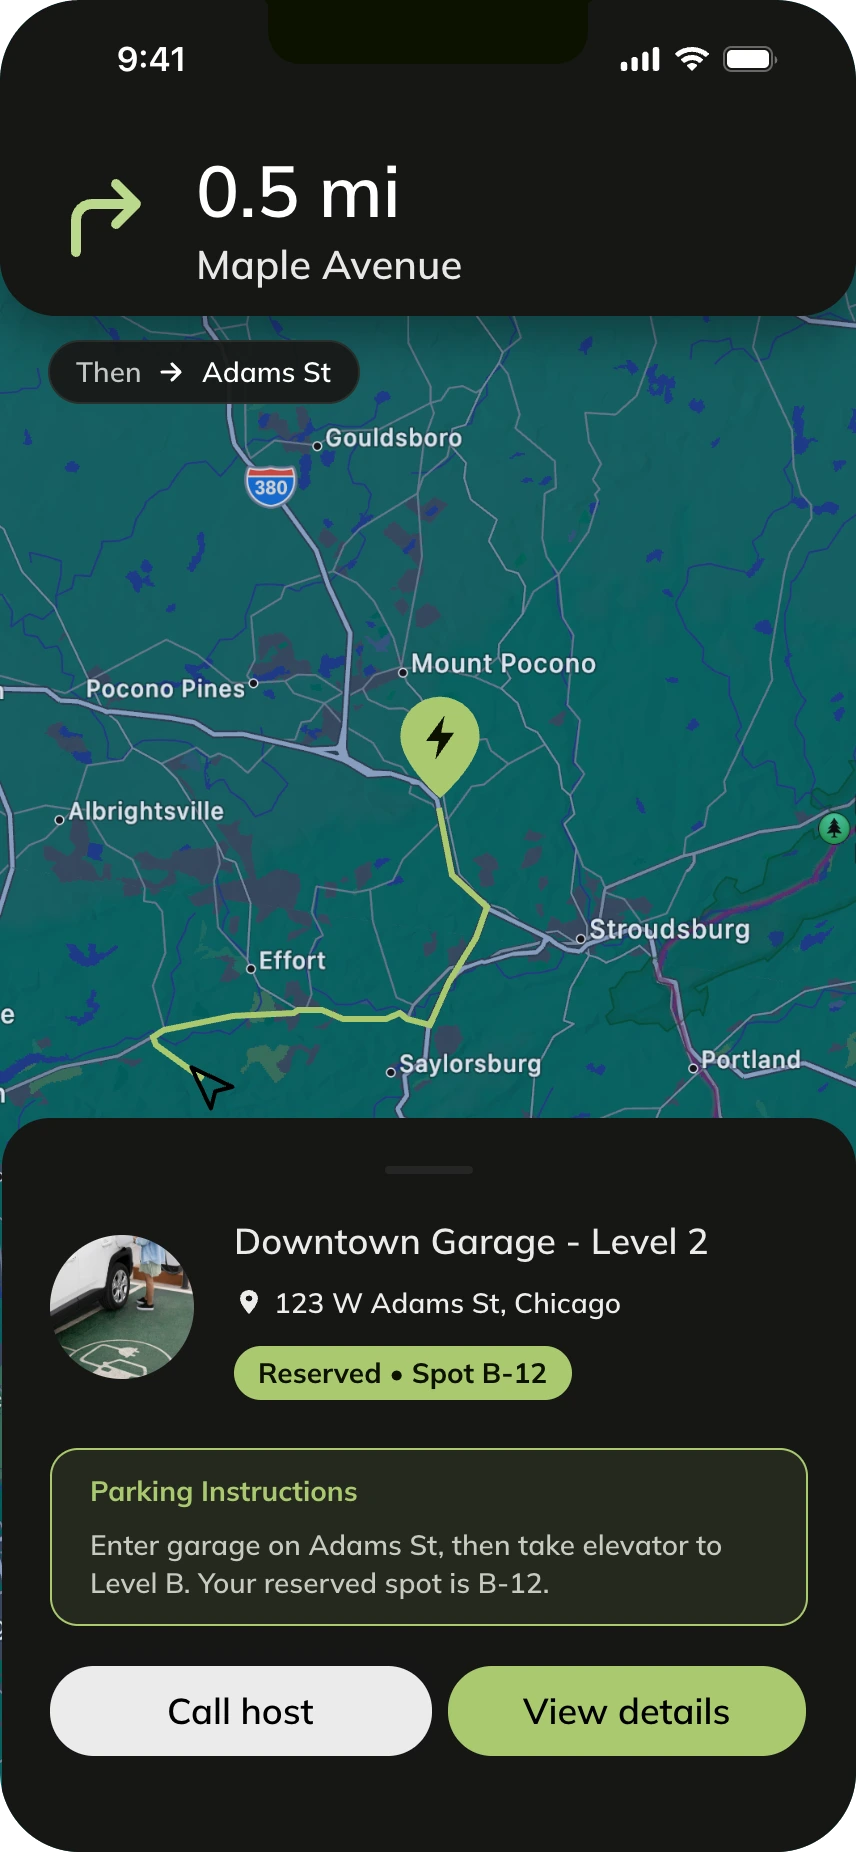
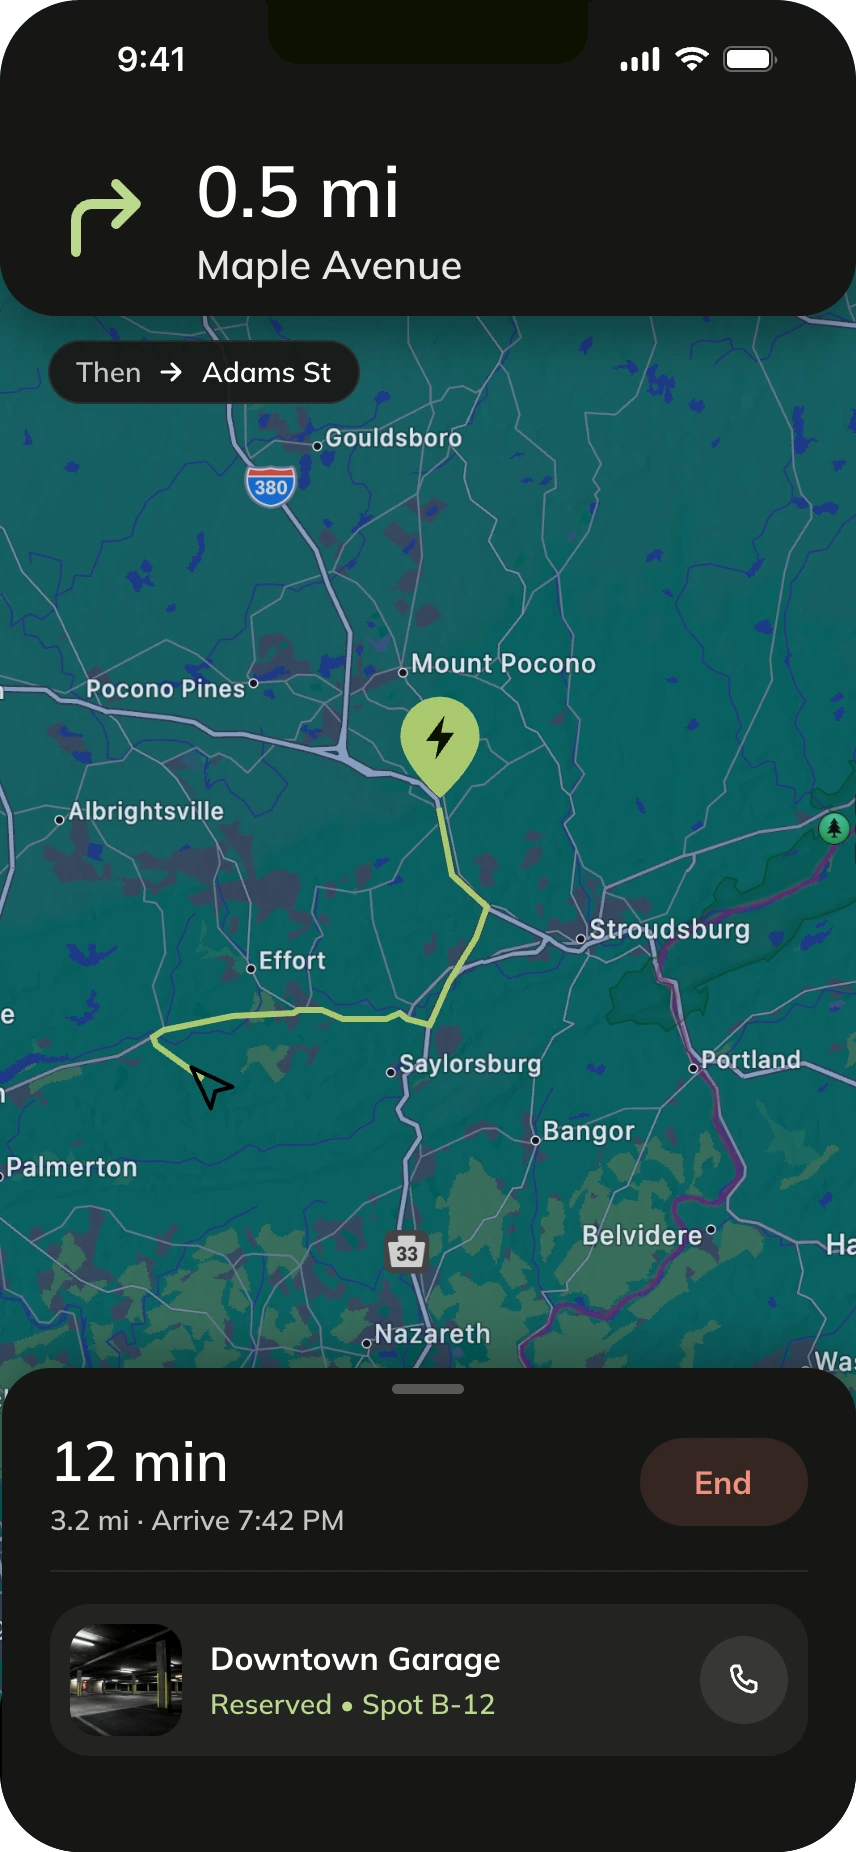
What should a driver see after they book?
I designed navigation to show directions first, with the reservation pinned underneath. The original design put the address, parking instructions, and two buttons over the map while the driver was still on the road, covering more than 40% of the screen.
Option A: everything on one sheet
Option B: route first
Seeing the value
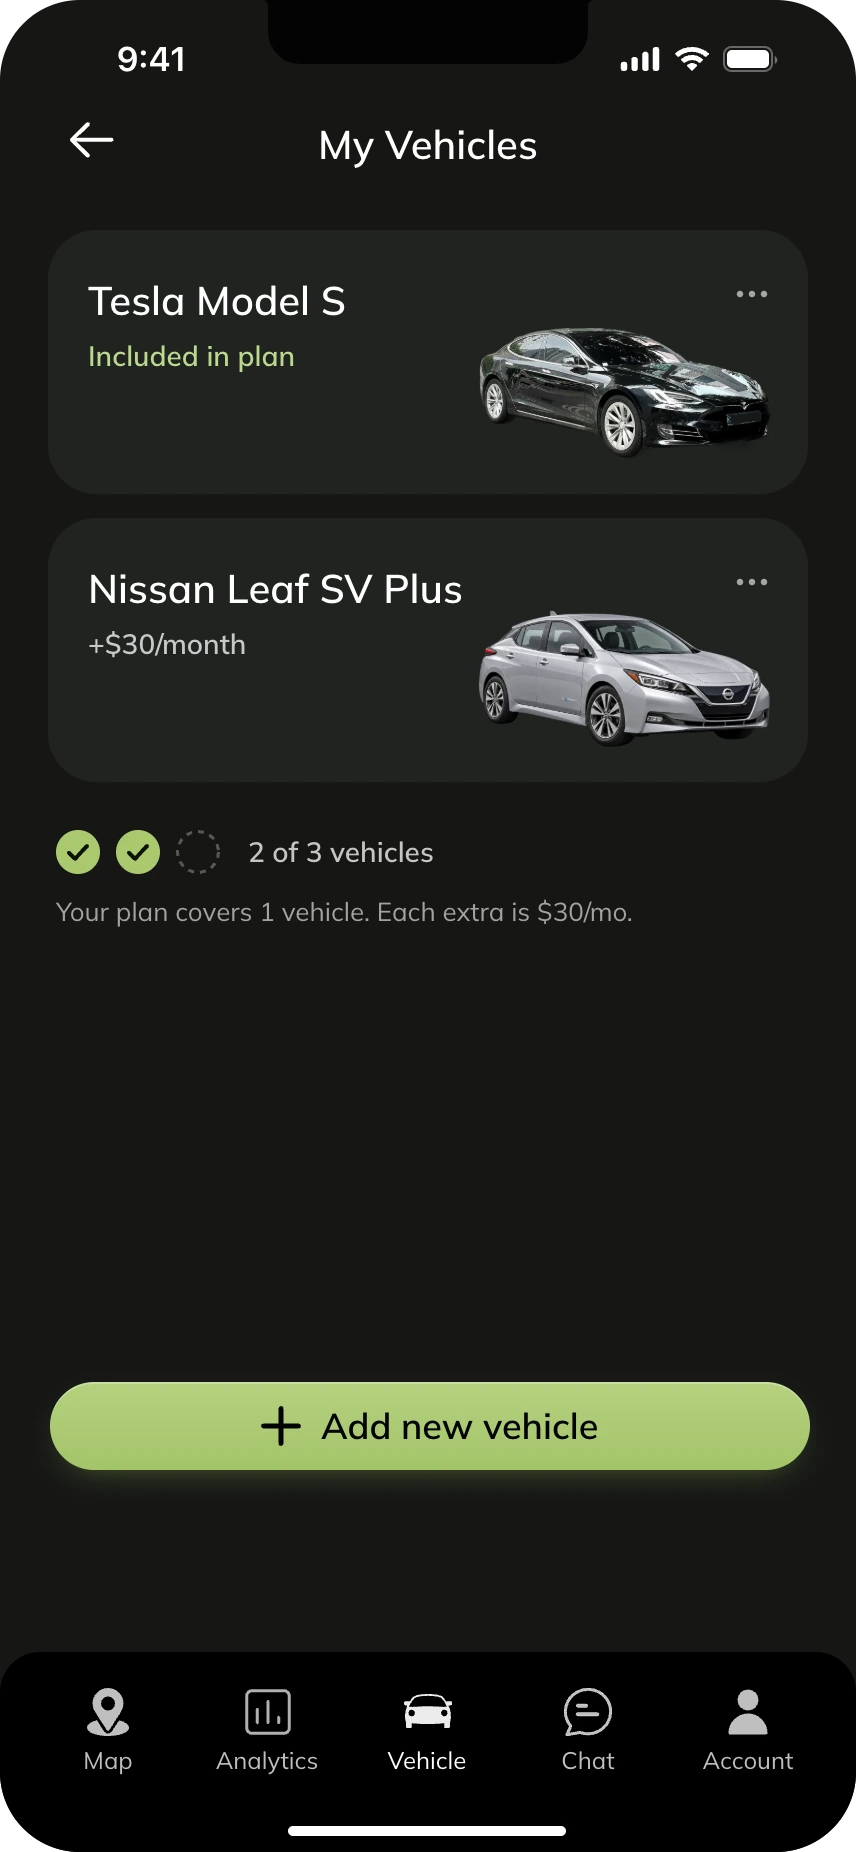
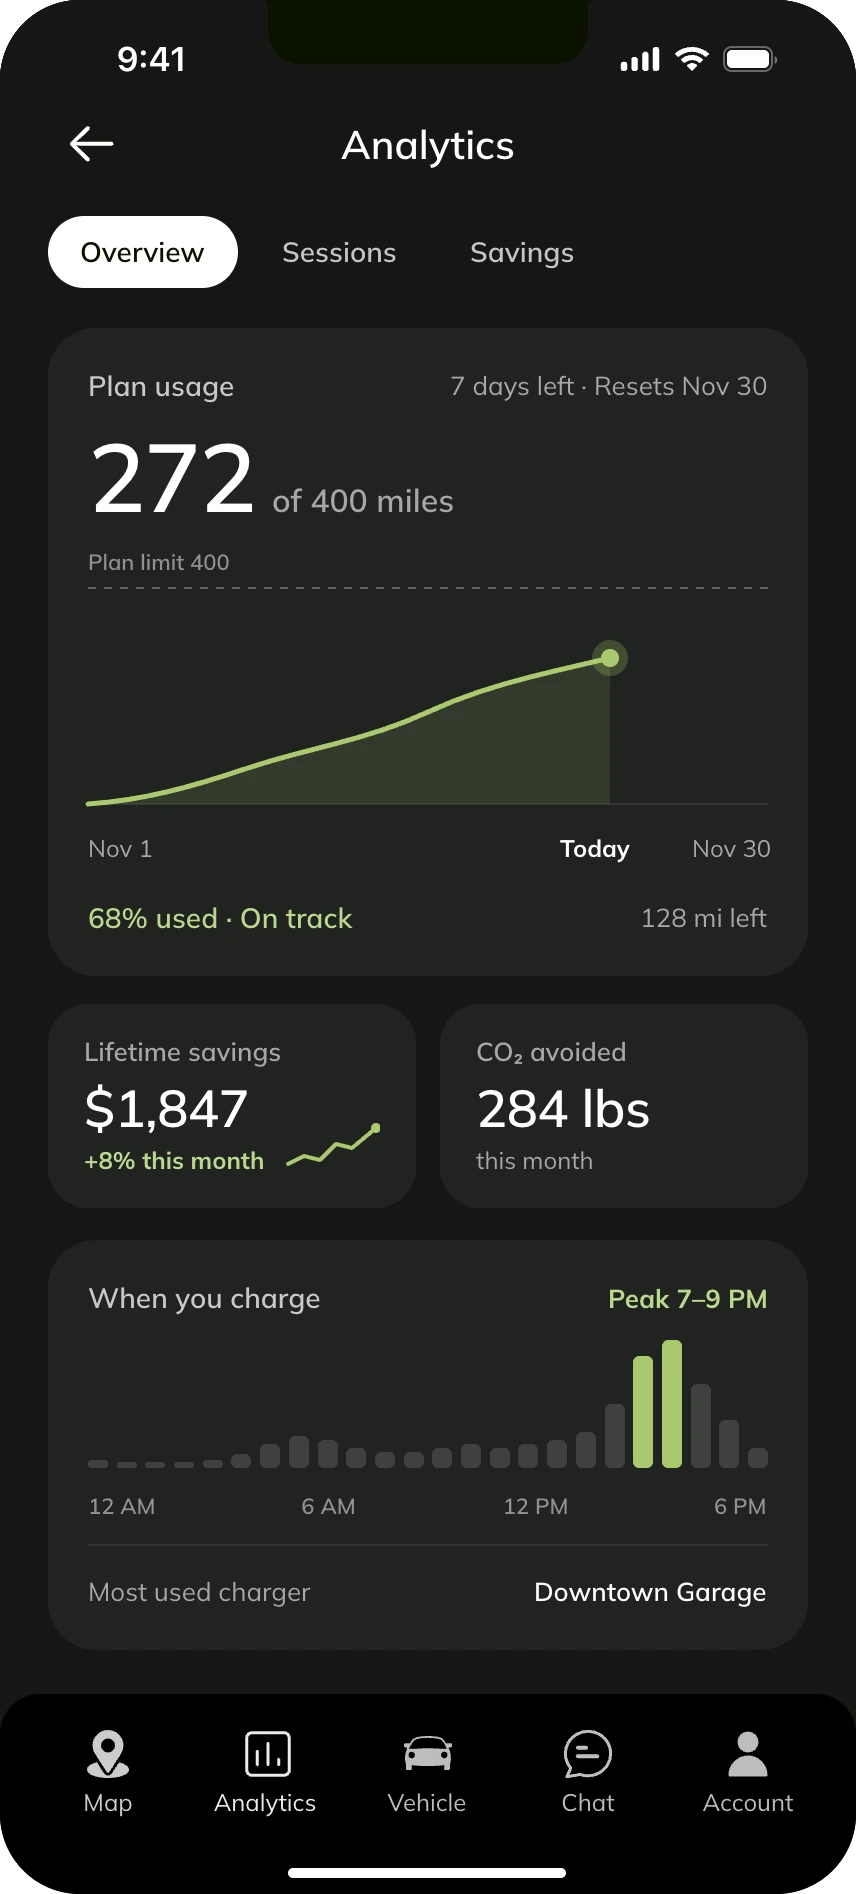
Drivers had no way to understand their charging behavior, plan usage, or savings, so they doubted the value of their subscription.
“I don't know if this is a good deal or not.”
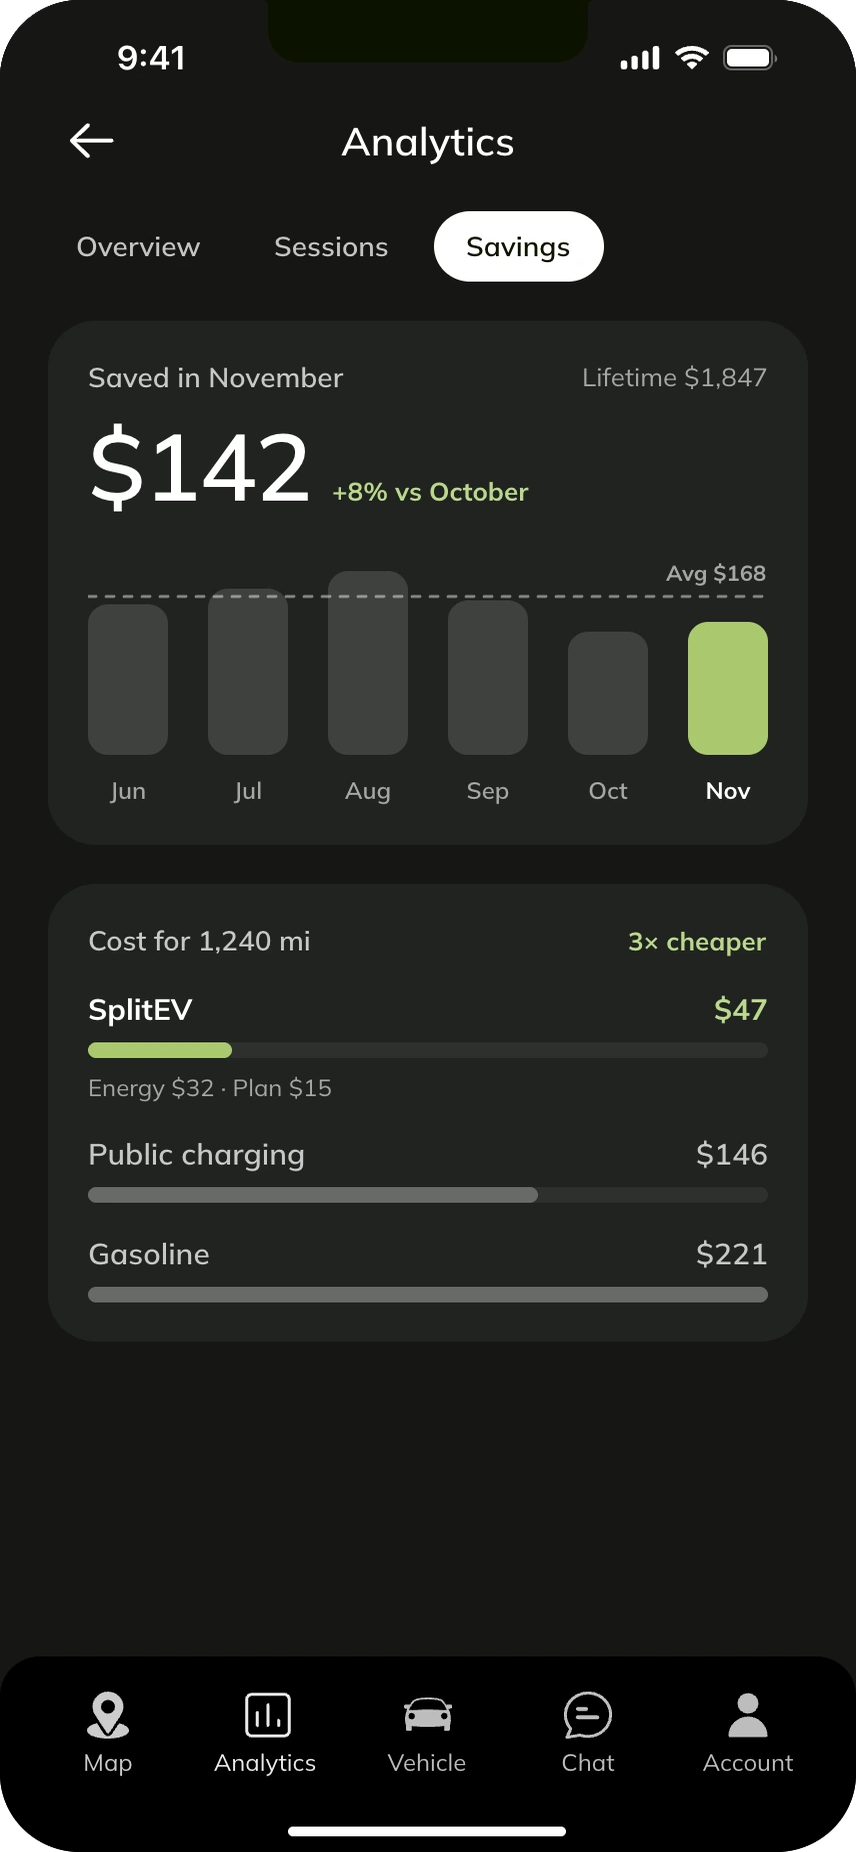
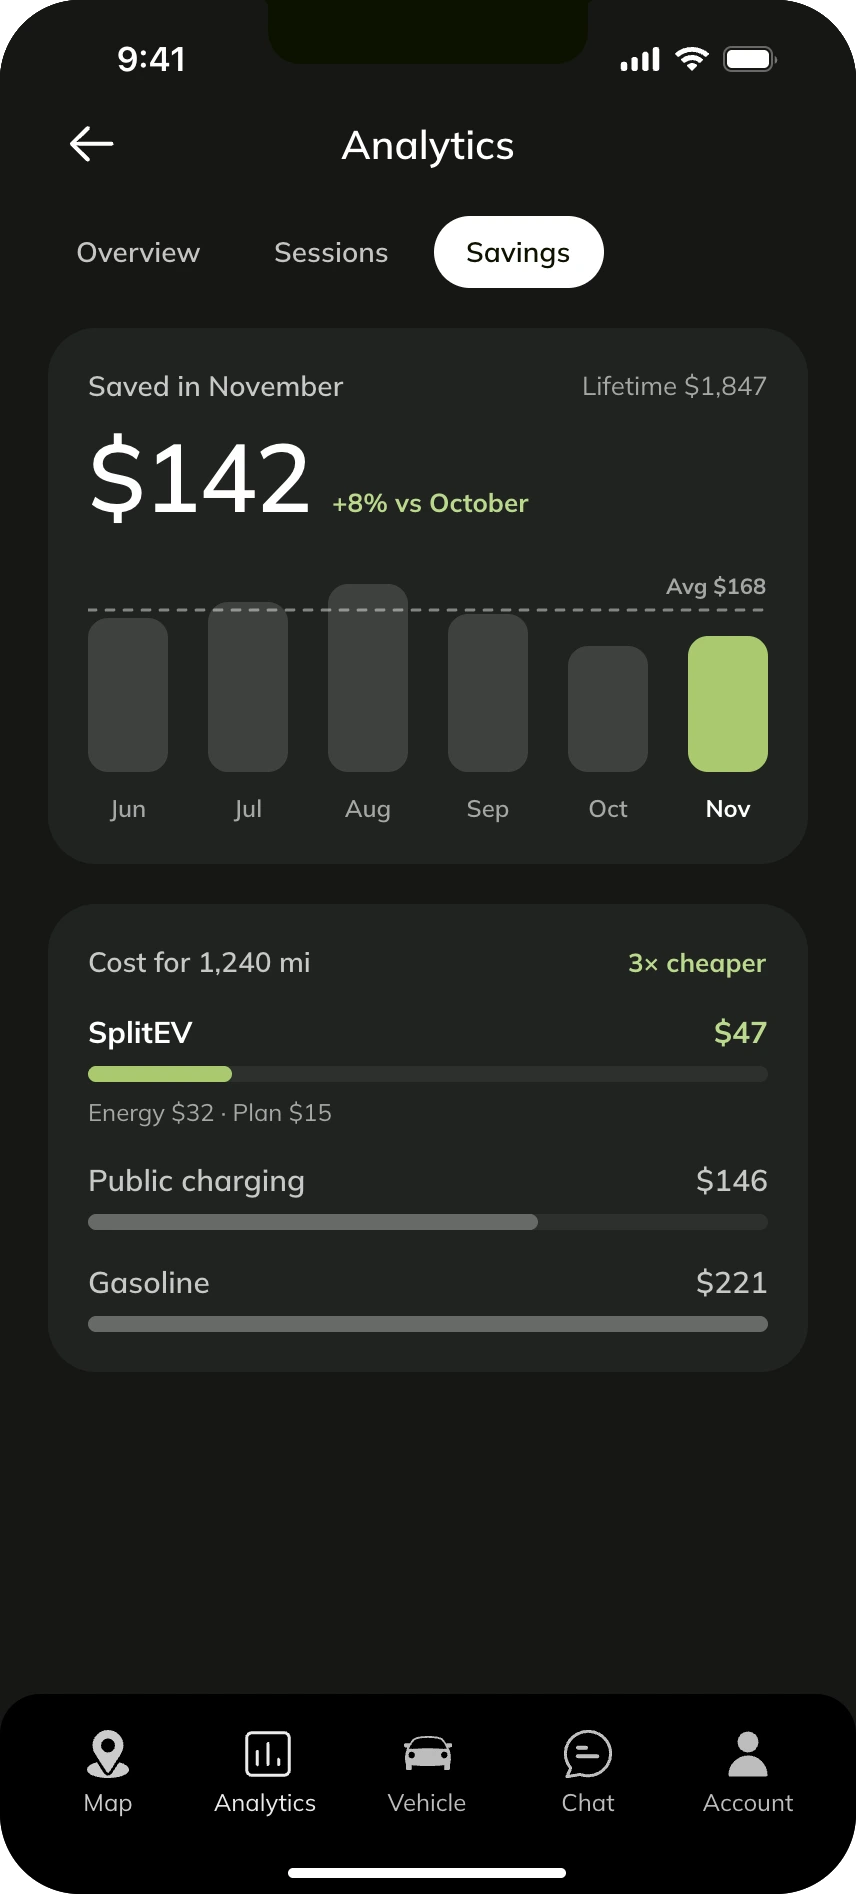
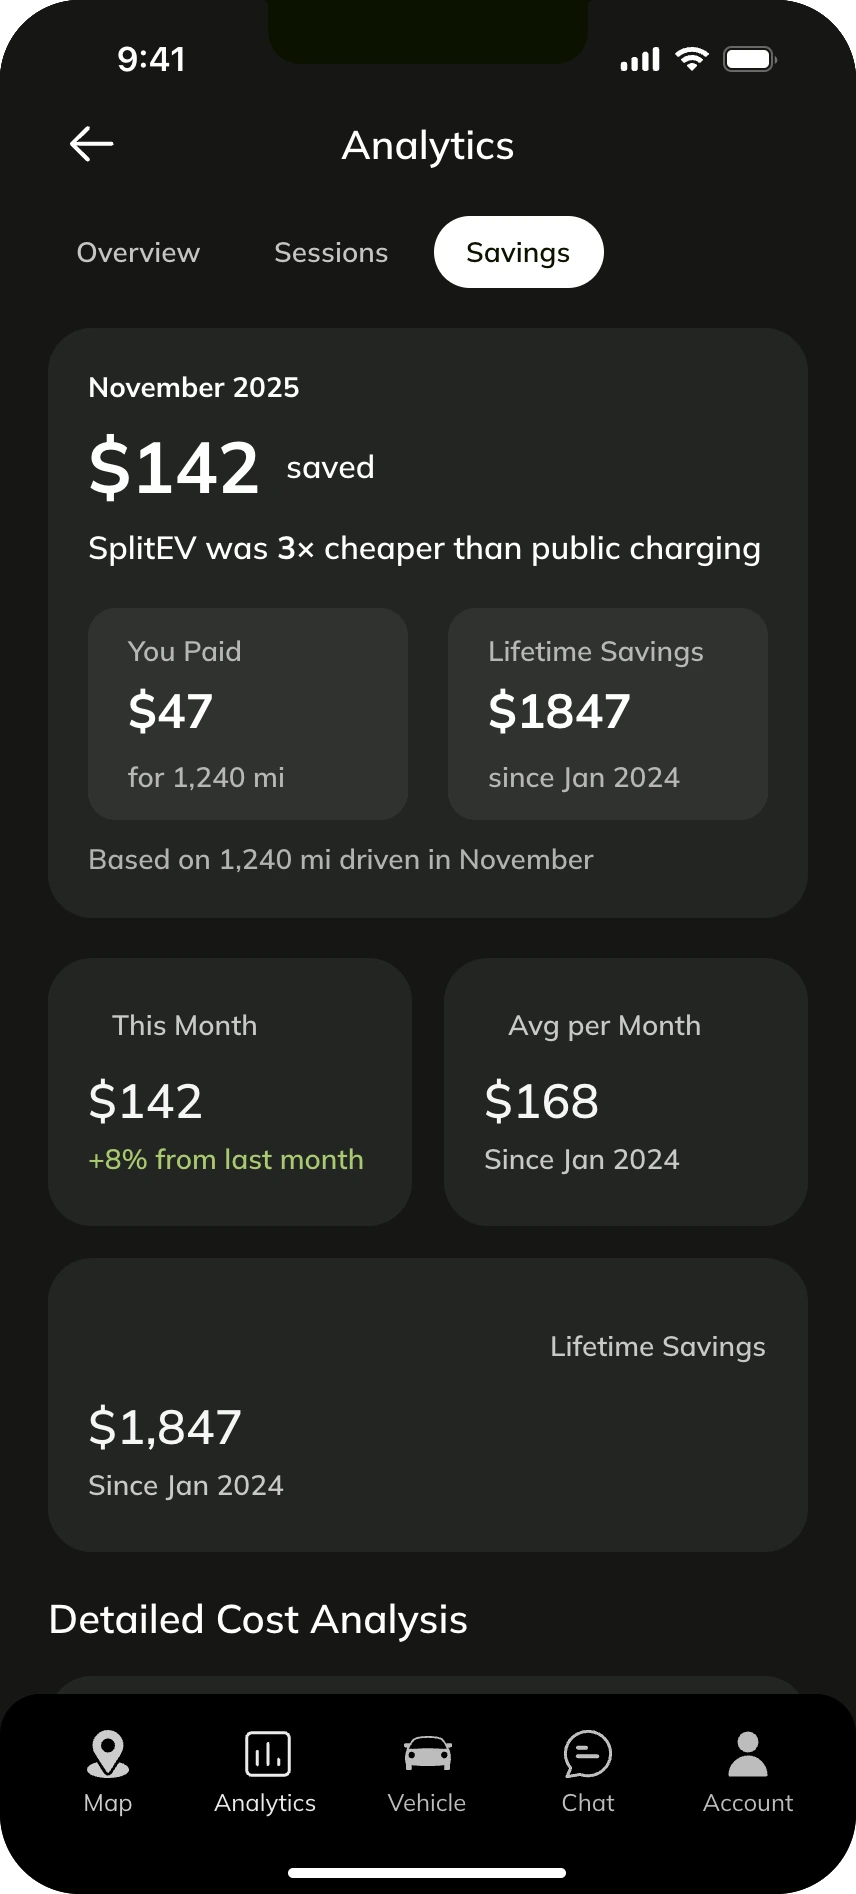
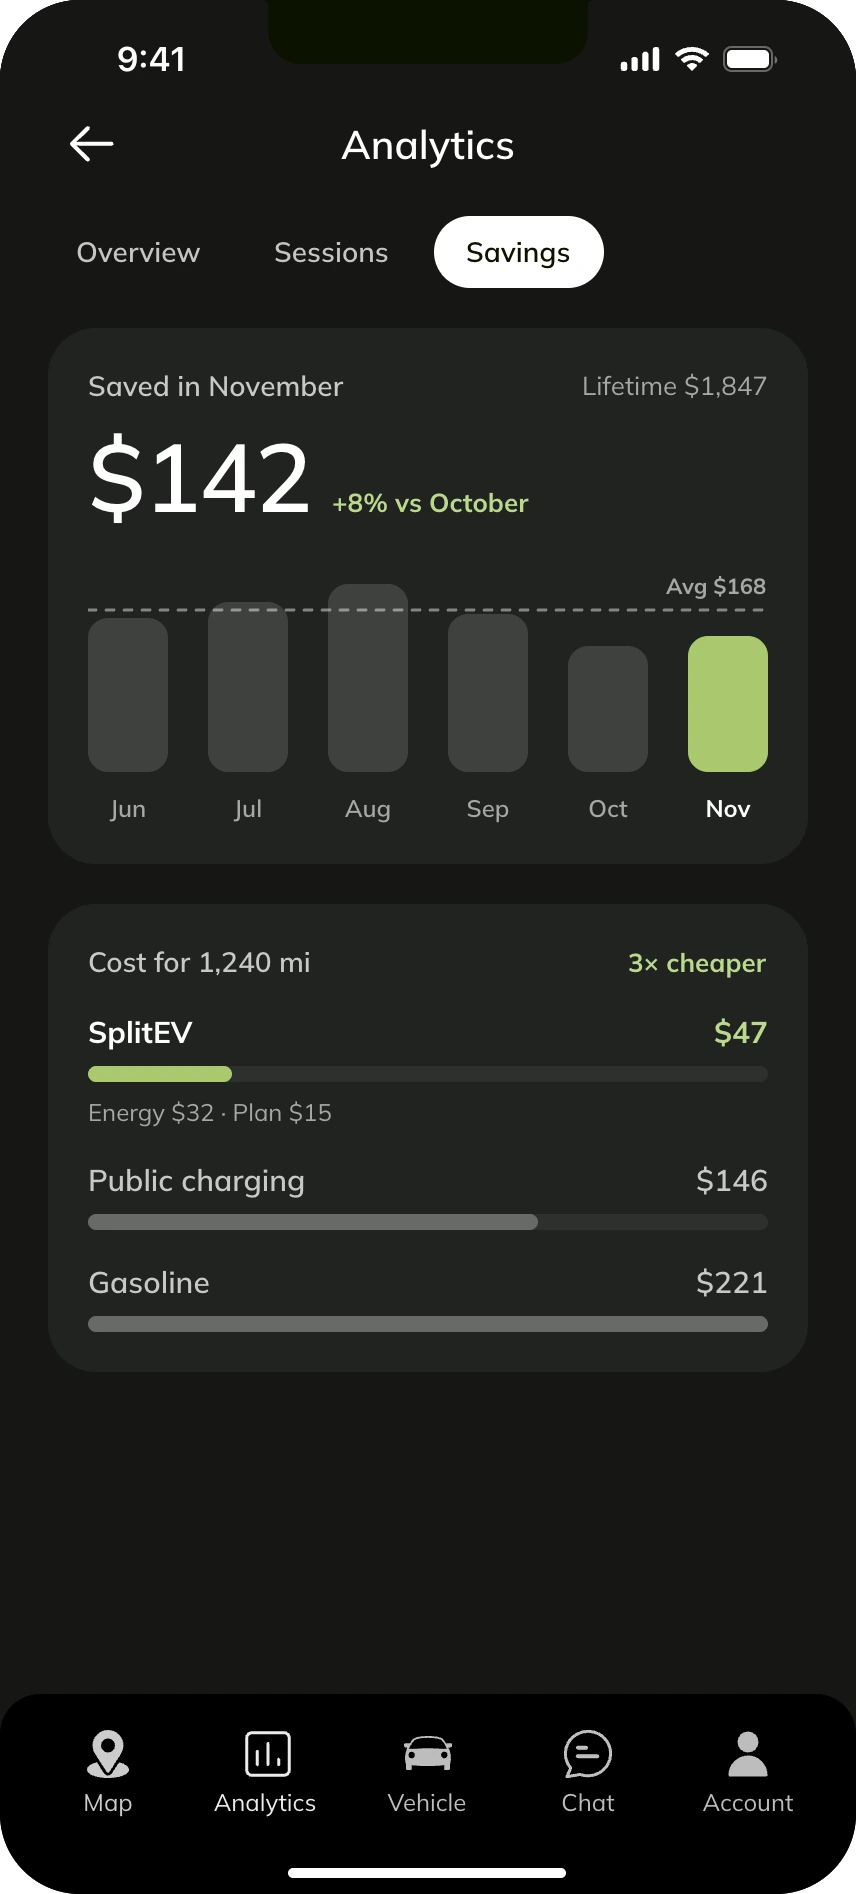
How can a driver tell the subscription is a good deal?
I chose to highlight a key impact metric, then one comparison. The original design was visually cluttered and difficult to scan. For a dashboard, we wanted to show the most important information in a clear and concise way.
Option A: a card for every number
Option B: one comparison
Solution
A driver can find a charger, get there, and know it's worth it.
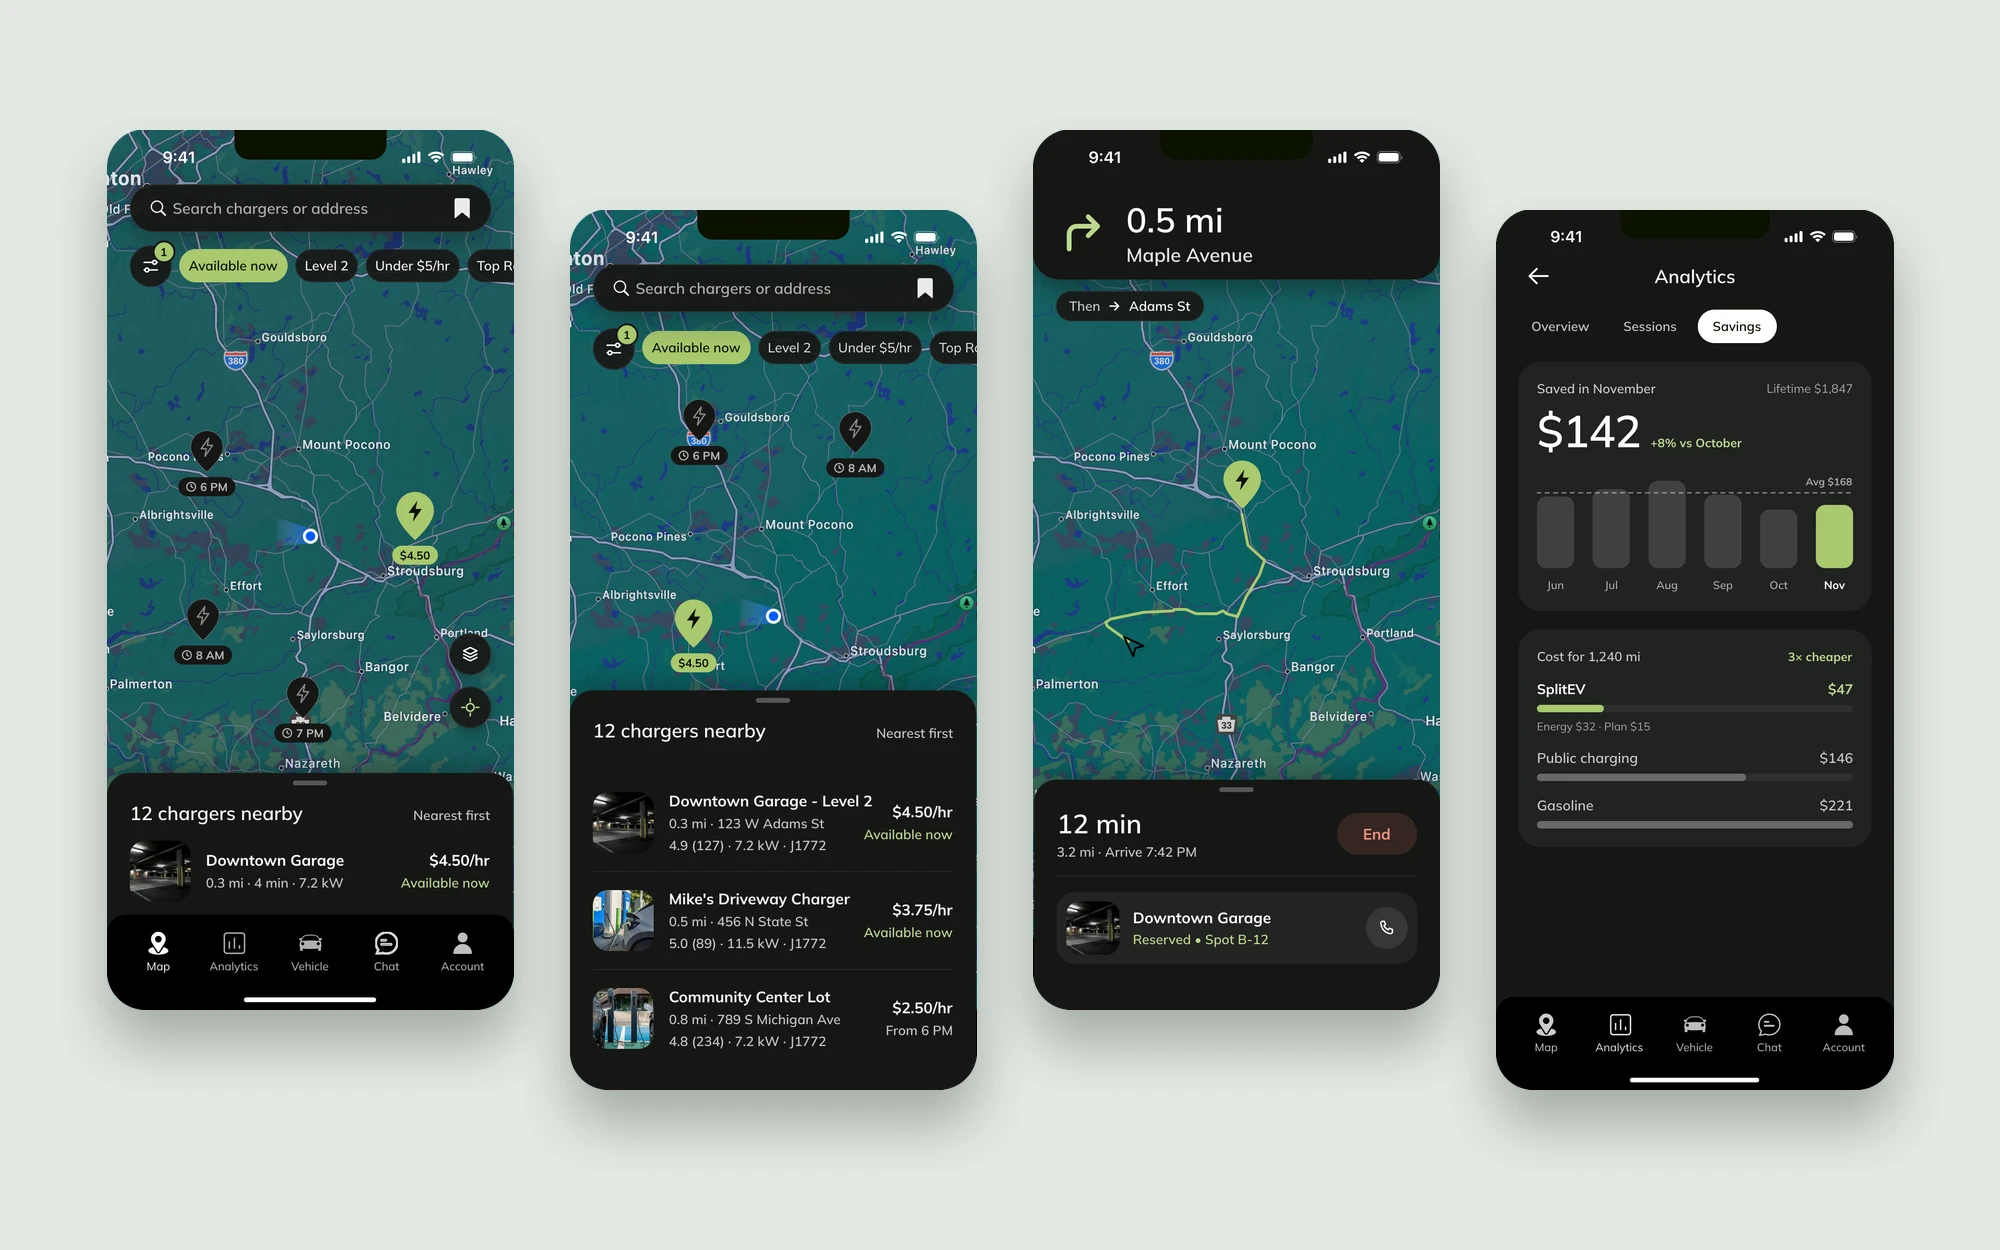
Nearly 60% less onboarding friction
24 screens down to 10, and 119 form elements down to 53
Chargers you can judge from the map
Price and availability sit on the pin, with the nearest charger one glance away
A clear answer on value
One number and one comparison tell drivers if SplitEV is a good deal
Reflection
Prioritize the sprint, not the backlog
Without a product manager to think about long-term vision and scalability, I prioritized tasks for each sprint rather than mindlessly accepting Phase 2+ backlog requests.
Think in systems
I envisioned how retrofitting new features would interact with the current infrastructure and cascade down, in order to save time and development costs. This way, I was able to shape the direction of the MVP so that we would have a successful and sustainable launch.